
What Did My Job Actually Use? Slurm Accounting with sacct and seff on Your HPC Auto Scale Cluster
Learn how to check what your Slurm jobs really used on a RONIN HPC Auto Scale Cluster with sacct and seff, then right-size your next job so it asks for what it needs.



Your job finished. Great! But did it actually use the 2 CPUs and 6 GB of memory you asked for? Or did it sit on one CPU and a few hundred MB, holding a whole node while other jobs waited in the queue?
Every HPC Auto Scale Cluster in RONIN runs native Slurm with job accounting switched on for you, so you do not have to guess. In this tutorial, we will run a handful of small jobs, then use seff to get a one-page report card for each job, sacct to dig into the details, and both to find out why a job failed. Then we will use the report card to right-size a job so it asks for what it needs.
This guide is for researchers who are comfortable submitting Slurm jobs with sbatch. If you have not met the new clusters yet, start with Meet the New HPC Auto Scale Clusters.
Why accounting matters
Each job gets the CPUs and memory it asks for, and several jobs share a node until its CPUs or memory are used up. That makes your requests important:
- Ask for too much and your job holds CPUs and memory it never uses. Other jobs (including your own) cannot use them, so they wait in the queue or launch extra compute nodes.
- Ask for too little and your job can run slowly, use more memory than was set aside for it.
- Ask for the right amount and more jobs fit on each node, so your work starts sooner and finishes sooner.
Slurm records what every job asked for and what it actually used. Checking that record after a test run is the easiest way to get your next request right.
How it works
On your cluster:
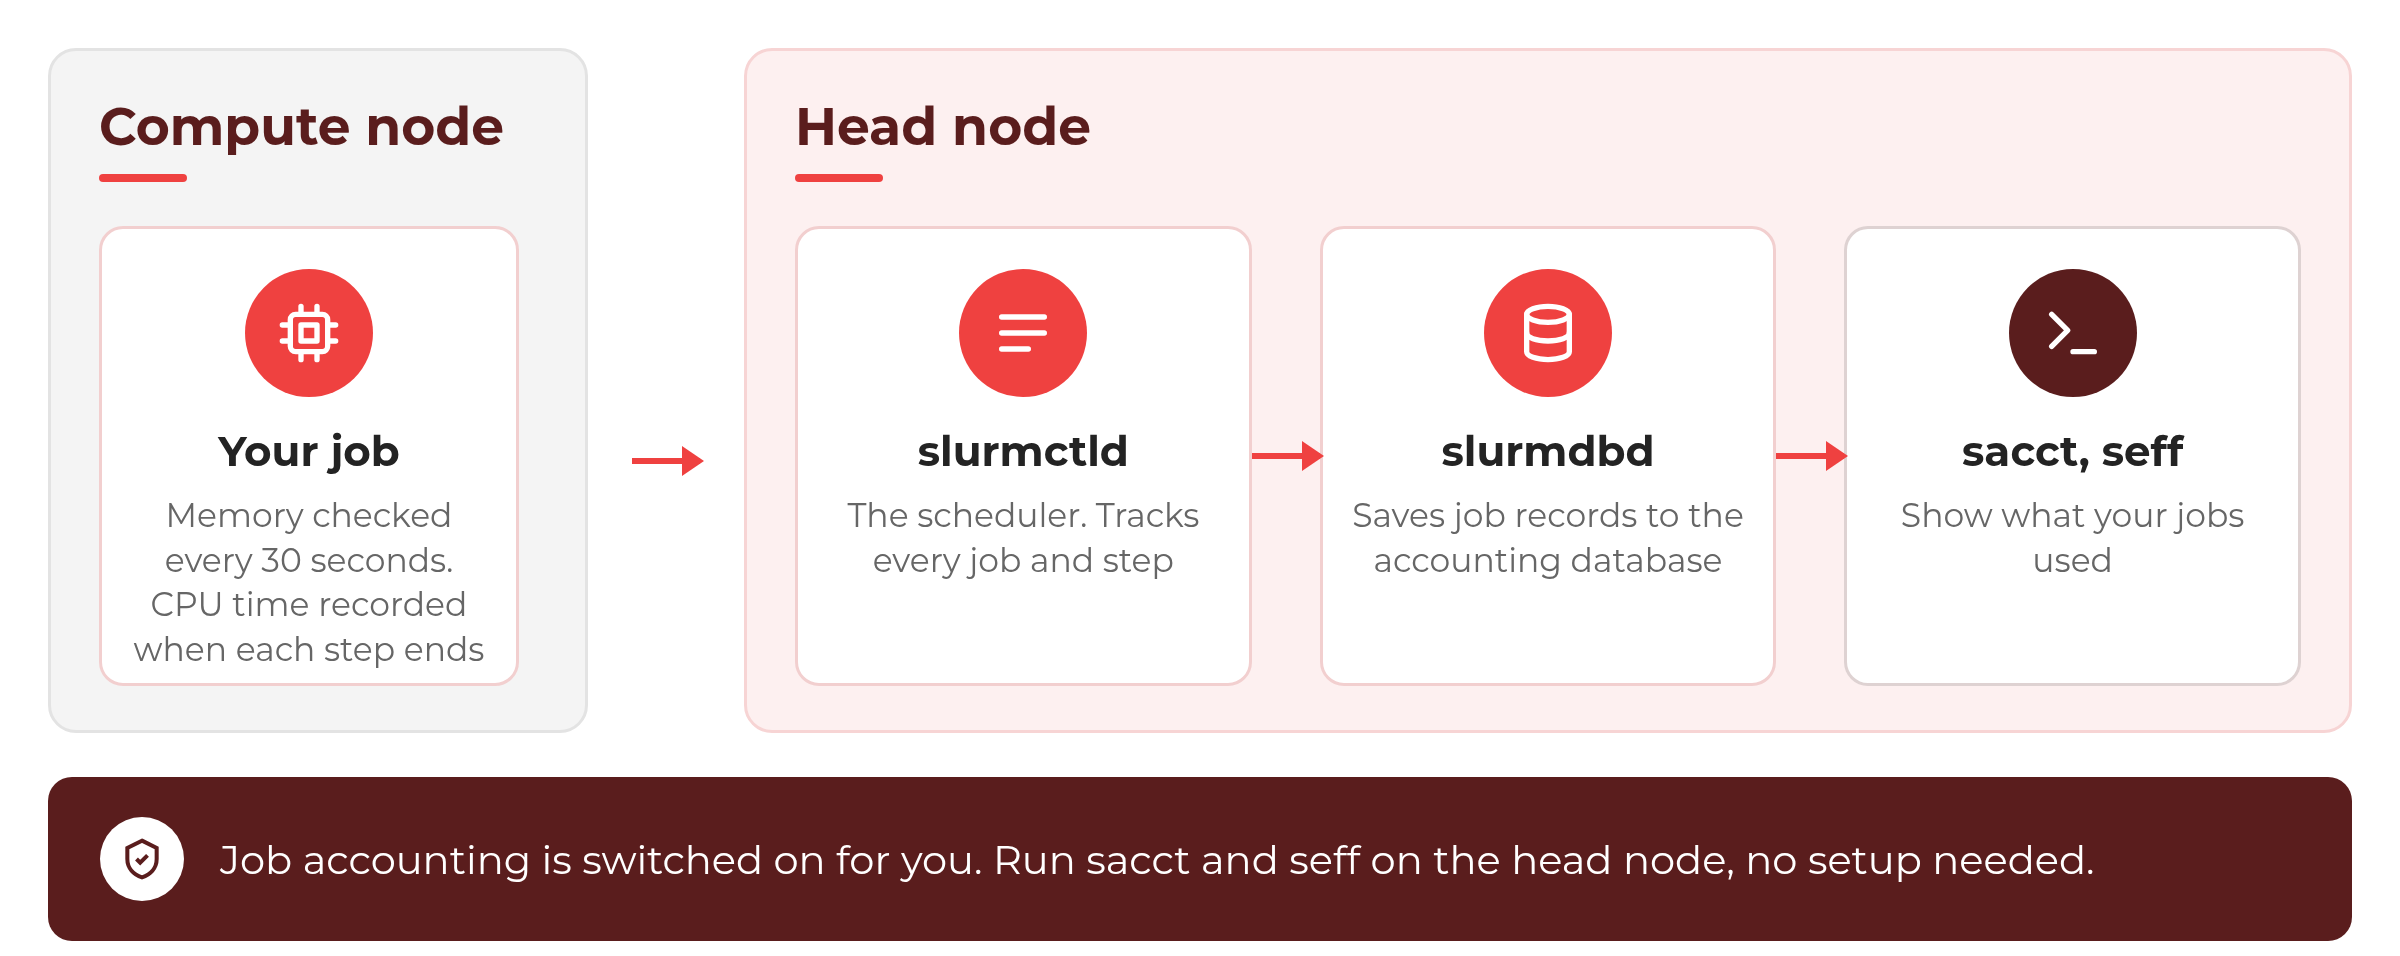
- While a job runs, Slurm checks its memory use every 30 seconds and records its total CPU time when each step ends.
- slurmctld, the Slurm scheduler on your head node, keeps track of every job and job step.
- slurmdbd, also on your head node, saves each job's record to the accounting database.
- sacct and seff read those records back for you, from the head node.
Before you begin
You will need:
- A running HPC Auto Scale Cluster. Any size will do. A cluster with Min nodes set to 0 is perfect for this tutorial.
- Your cluster's SSH key, so you can log in to the head node.
- A few finished jobs to look at. Any jobs you have run today will work, or follow along with the examples below.
- A basic idea of how Slurm job scripts work. If #SBATCH directives are new to you, start with our simple Slurm guide for beginners.
The examples in this post come from a cluster with t3.large compute nodes (2 vCPUs and 8 GiB of memory each), Min nodes set to 0 and Max nodes set to 4. Slurm reports 7,372 MB of memory on each of these nodes.
Step 1: Connect to your head node
Open a terminal on your head node. The terminal button on your cluster's card in RONIN LINK is the quickest way. You can also SSH to your cluster's address from your own terminal, using your cluster's SSH key:
ssh -i ~/.ssh/your-cluster-key.pem ubuntu@slurm-accounting.hpc.ronin.cloud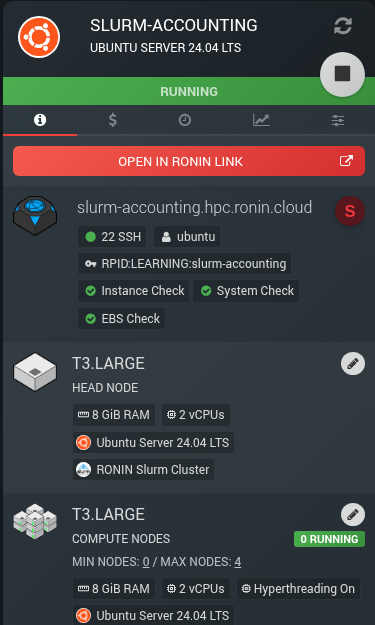
Step 2: Run some test jobs
We ran a small set of example jobs, each designed to tell a different story. Every job ran a short Python script that keeps CPUs busy and holds a set amount of memory, so the numbers are easy to read:
| Job | What it asked for | What it did |
|---|---|---|
| well-sized | 2 CPUs, 1 GB | Kept both CPUs busy and used about 750 MB |
| over-asked | 2 CPUs, 6 GB | Used 1 CPU and about 315 MB |
| right-sized | 1 CPU, 512 MB | The same work as over-asked, with a smaller request |
| oom-demo | 1 CPU, 256 MB | Used more memory than it asked for, about 1 GB |
| fail-demo | 1 CPU, 256 MB | Tried to read a file that does not exist |
| timeout-demo | 1 CPU, 256 MB and a 1 minute time limit | Tried to run for 5 minutes |
| cancel-demo | 1 CPU, 256 MB | Cancelled with scancel |
| array-demo | 4 tasks, 1 CPU and 512 MB each | One task had a missing input file |
We will refer to these jobs as examples throughout this blog post.
Step 3: Get a report card with seff
Once your jobs finish, start with seff. It prints a short report card for one finished job, showing how it ended and how much of its CPUs and memory it actually used, with the maths done for you. For most jobs, this is all you need. seff is installed on the head node, so just give it a job ID e.g. seff 1 to get a report card for job 1.
squeue while the job is in the queue, or with sacct after it has finished, which we cover in the next section. For a job array, give seff the task ID, for example seff 7_3.Here is the job script for the over-asked example job, which asks for 2 CPUs and 6 GB of memory:
#!/bin/bash
#SBATCH --job-name=over-asked
#SBATCH --cpus-per-task=2
#SBATCH --mem=6G
#SBATCH --output=%x-%j.out
python3 busy.py 1 150 300
And here is the seff report card for the over-asked job:
seff 2Job ID: 2
Cluster: slurm-accounting-head
User/Group: ubuntu/ubuntu
State: COMPLETED (exit code 0)
Nodes: 1
Cores per node: 2
CPU Utilized: 00:02:30
CPU Efficiency: 50.00% of 00:05:00 core-walltime
Job Wall-clock time: 00:02:30
Memory Utilized: 314.72 MB
Memory Efficiency: 5.12% of 6.00 GBThe two lines that matter most:
- CPU Efficiency is the CPU time the job used, divided by its CPUs × its wall-clock time (the core-walltime). 100% would mean every CPU it asked for was busy for the whole run.
- Memory Efficiency is the most memory the job used (its MaxRSS), divided by the memory it asked for. Somewhere around 60 to 80% leaves sensible headroom. Over 100% means the job used more memory than it asked for (see the memory note in Step 4).
50.00% CPU efficiency on 2 CPUs means one CPU did all the work while the other sat idle. 5.12% memory efficiency means the job used 314.72 MB of the 6 GB it held. That tells us exactly what this job should ask for instead:
- It used 1 CPU, so ask for
--cpus-per-task=1. - It used 314.72 MB at most, so ask for
--mem=512M. That leaves headroom without holding gigabytes it will never touch.
So let's fix the script. Here is the right-sized version, doing exactly the same work:
#!/bin/bash
#SBATCH --job-name=right-sized
#SBATCH --cpus-per-task=1
#SBATCH --mem=512M
#SBATCH --output=%x-%j.out
python3 busy.py 1 150 300
And here is its new seff report card:
seff 11Job ID: 11
Cluster: slurm-accounting-head
User/Group: ubuntu/ubuntu
State: COMPLETED (exit code 0)
Cores: 1
CPU Utilized: 00:02:30
CPU Efficiency: 100.00% of 00:02:30 core-walltime
Job Wall-clock time: 00:02:30
Memory Utilized: 315.02 MB
Memory Efficiency: 61.53% of 512.00 MBBoth numbers look much better now. CPU efficiency is 100.00%, because the one CPU the job asked for was busy the whole time. Memory efficiency is 61.53% of 512 MB, which leaves sensible headroom without holding gigabytes the job never touches.
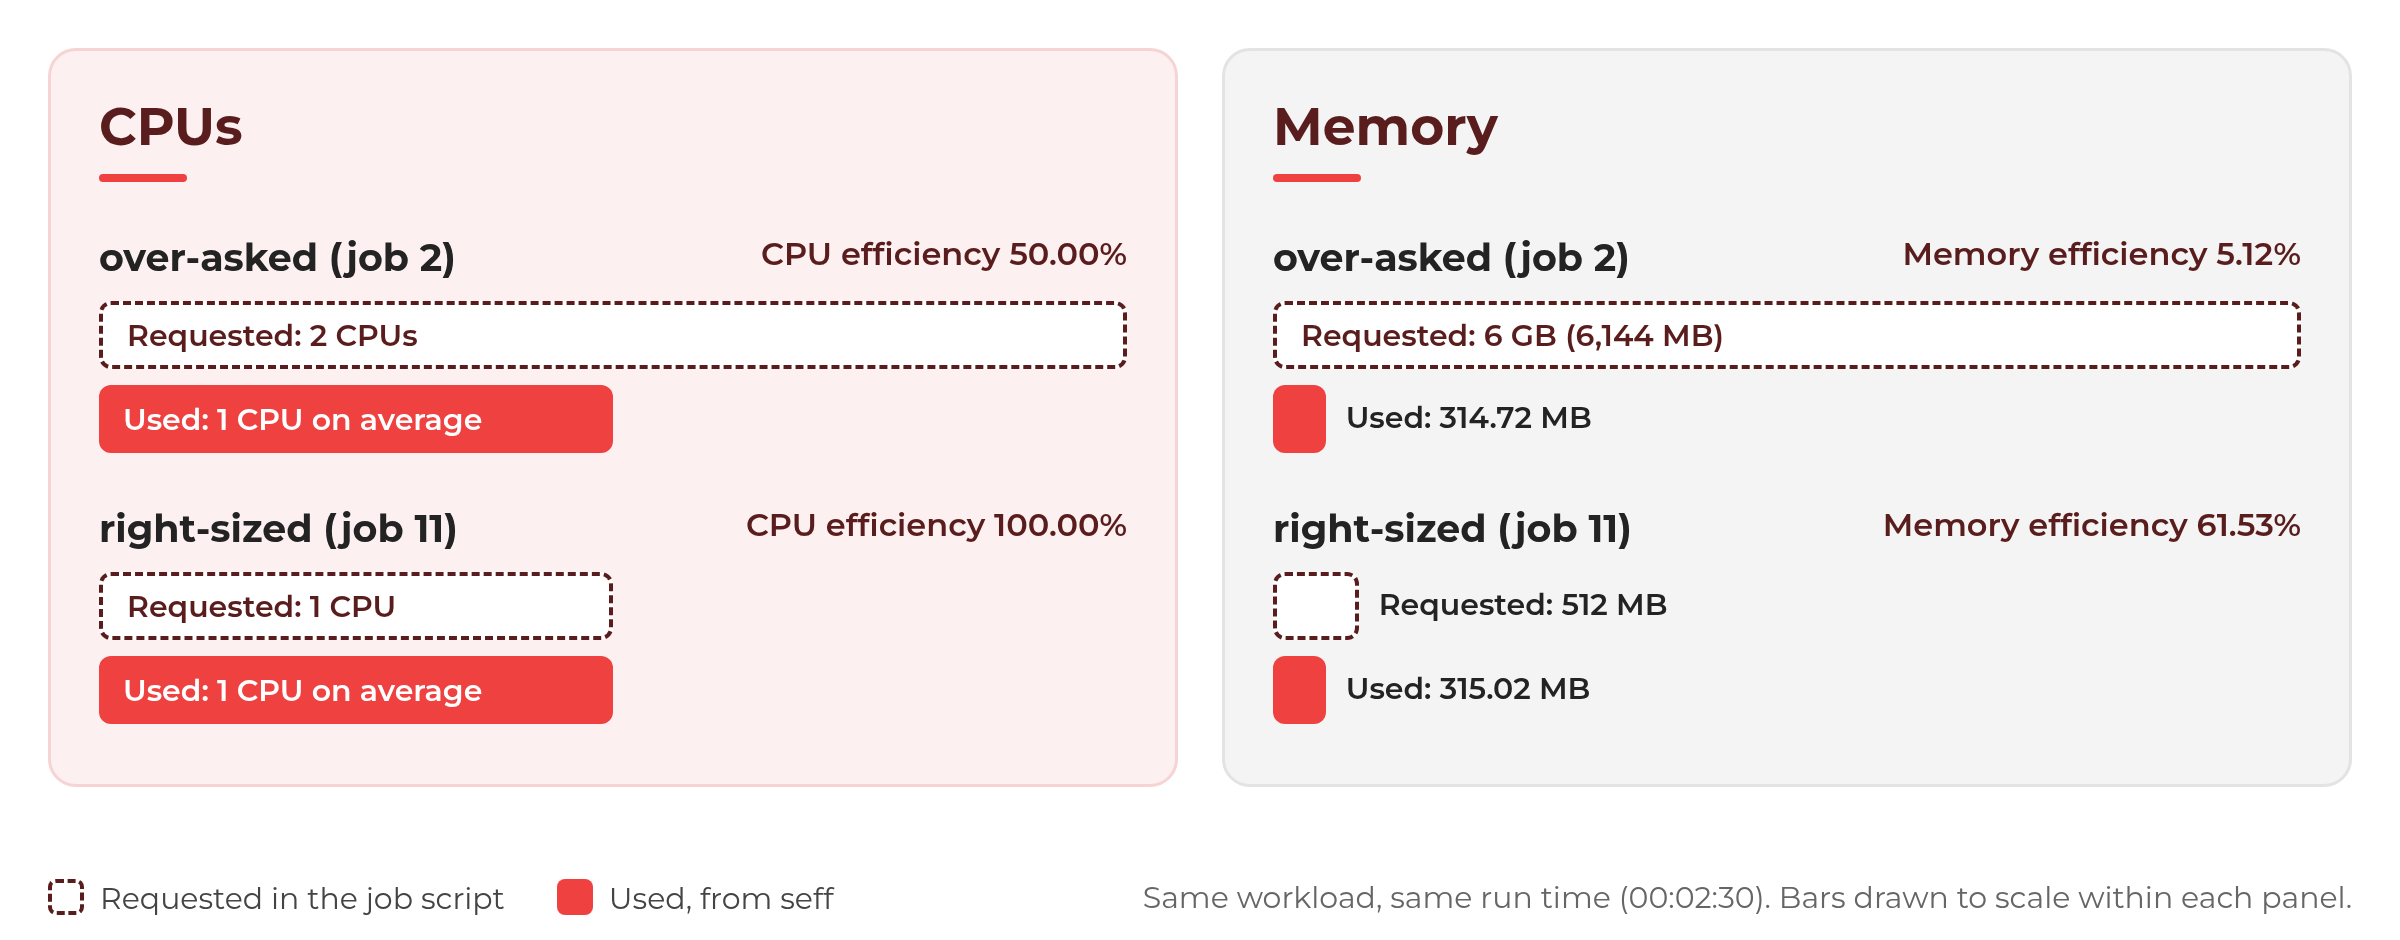
Both jobs took 2 minutes 30 seconds, so the smaller request cost the job nothing. The difference is what it left for everyone else:
- The over-asked job held both CPUs on ip-10-255-2-6 and 6 GB of the node's 7,372 MB, so no other job could use that node's CPUs while it ran.
- The right-sized job held 1 CPU and 512 MB on ip-10-255-2-8. While it ran, another task could run alongside it on the same node.
Note that right-sizing works both ways. If seff shows CPU efficiency close to 100% on every CPU you asked for, your job may finish sooner if you give it more CPUs, as long as your software can use them. Check your software's documentation for how to set its thread count. Our well-sized job shows this. It asks for 2 CPUs and tells the Python script to run 2 workers, so it does twice the work of the right-sized job in the same time. We also gave it more memory, because it holds more:
#!/bin/bash
#SBATCH --job-name=well-sized
#SBATCH --cpus-per-task=2
#SBATCH --mem=1G
#SBATCH --output=%x-%j.out
srun python3 busy.py 2 150 700
The srun here is optional. We added it so this job shows a numbered step in sacct, which you'll see in Step 4.
Now let's see its seff report card:
seff 12Job ID: 12
Cluster: slurm-accounting-head
User/Group: ubuntu/ubuntu
State: COMPLETED (exit code 0)
Nodes: 1
Cores per node: 2
CPU Utilized: 00:05:00
CPU Efficiency: 99.34% of 00:05:02 core-walltime
Job Wall-clock time: 00:02:31
Memory Utilized: 751.39 MB
Memory Efficiency: 73.38% of 1.00 GBThis time the job kept both CPUs busy for almost the whole run (99.34%) and used about 750 MB of its 1 GB, which still leaves sensible headroom.
Step 4: See your jobs with sacct
seff covers one job at a time. sacct is for when you want more detail: all your jobs at once, each step inside a job, and the exact columns you choose. Run it with no options to start:
sacctJobID JobName Partition Account AllocCPUS State ExitCode
------------ ---------- ---------- ---------- ---------- ---------- --------
2 over-asked main default 2 COMPLETED 0:0
2.batch batch default 2 COMPLETED 0:0
3 oom-demo main default 1 COMPLETED 0:0
3.batch batch default 1 COMPLETED 0:0
4 fail-demo main default 1 FAILED 1:0
4.batch batch default 1 FAILED 1:0
5 timeout-d+ main default 1 TIMEOUT 0:0
5.batch batch default 1 CANCELLED 0:15
6 cancel-de+ main default 1 CANCELLED+ 0:0
6.batch batch default 1 CANCELLED 0:15
7_1 array-demo main default 1 COMPLETED 0:0
7_1.batch batch default 1 COMPLETED 0:0
7_2 array-demo main default 1 COMPLETED 0:0
7_2.batch batch default 1 COMPLETED 0:0
7_3 array-demo main default 1 FAILED 2:0
7_3.batch batch default 1 FAILED 2:0
7_4 array-demo main default 1 COMPLETED 0:0
7_4.batch batch default 1 COMPLETED 0:0
11 right-siz+ main default 1 COMPLETED 0:0
11.batch batch default 1 COMPLETED 0:0
12 well-sized main default 2 COMPLETED 0:0
12.batch batch default 2 COMPLETED 0:0
12.0 python3 default 2 COMPLETED 0:0 With no options, sacct shows your jobs since midnight, in the cluster's time zone, which is usually UTC. Each job can take up more than one line, because Slurm tracks the job as a whole and also the separate parts that ran inside it, which it calls job steps:
- The line with just the job ID (for example
12) is the whole job. Its state, elapsed time and resources cover everything the job did from start to finish. 12.batchis your job script. When you submit a script withsbatch, Slurm runs it as the batch step. If your script just runs commands directly, likepython3 analysis.py, all of that work happens inside.batch, and you'll only see the job line and the.batchline. That's normal, and it's how most simple jobs look.12.0,12.1and so on only appear if your script usessrun. Eachsruncommand inside the script starts a new numbered step, so you can see how long each part took and how much memory it used. Job 12 in this example ran its Python program withsrun, so it has a12.0step namedpython3. If you don't usesrun, you won't see these lines.
In short, if you just run sbatch with a plain script, look at the job line and the .batch line. The numbered steps only matter if you use srun to split your job into parts. We cover these Slurm options in more detail in our simple Slurm guide for beginners.
Job arrays get one job line (and one .batch line) per task, with IDs like 7_1 to 7_4. Use sacct -j 7 to see every task in array 7 at once, and compare their MaxRSS values to pick one --mem that suits them all.
A + at the end of a value means it was cut off to fit the column. You can widen any column, as shown below.
What the states mean
The State column tells you how each job ended. The ones you will meet most:
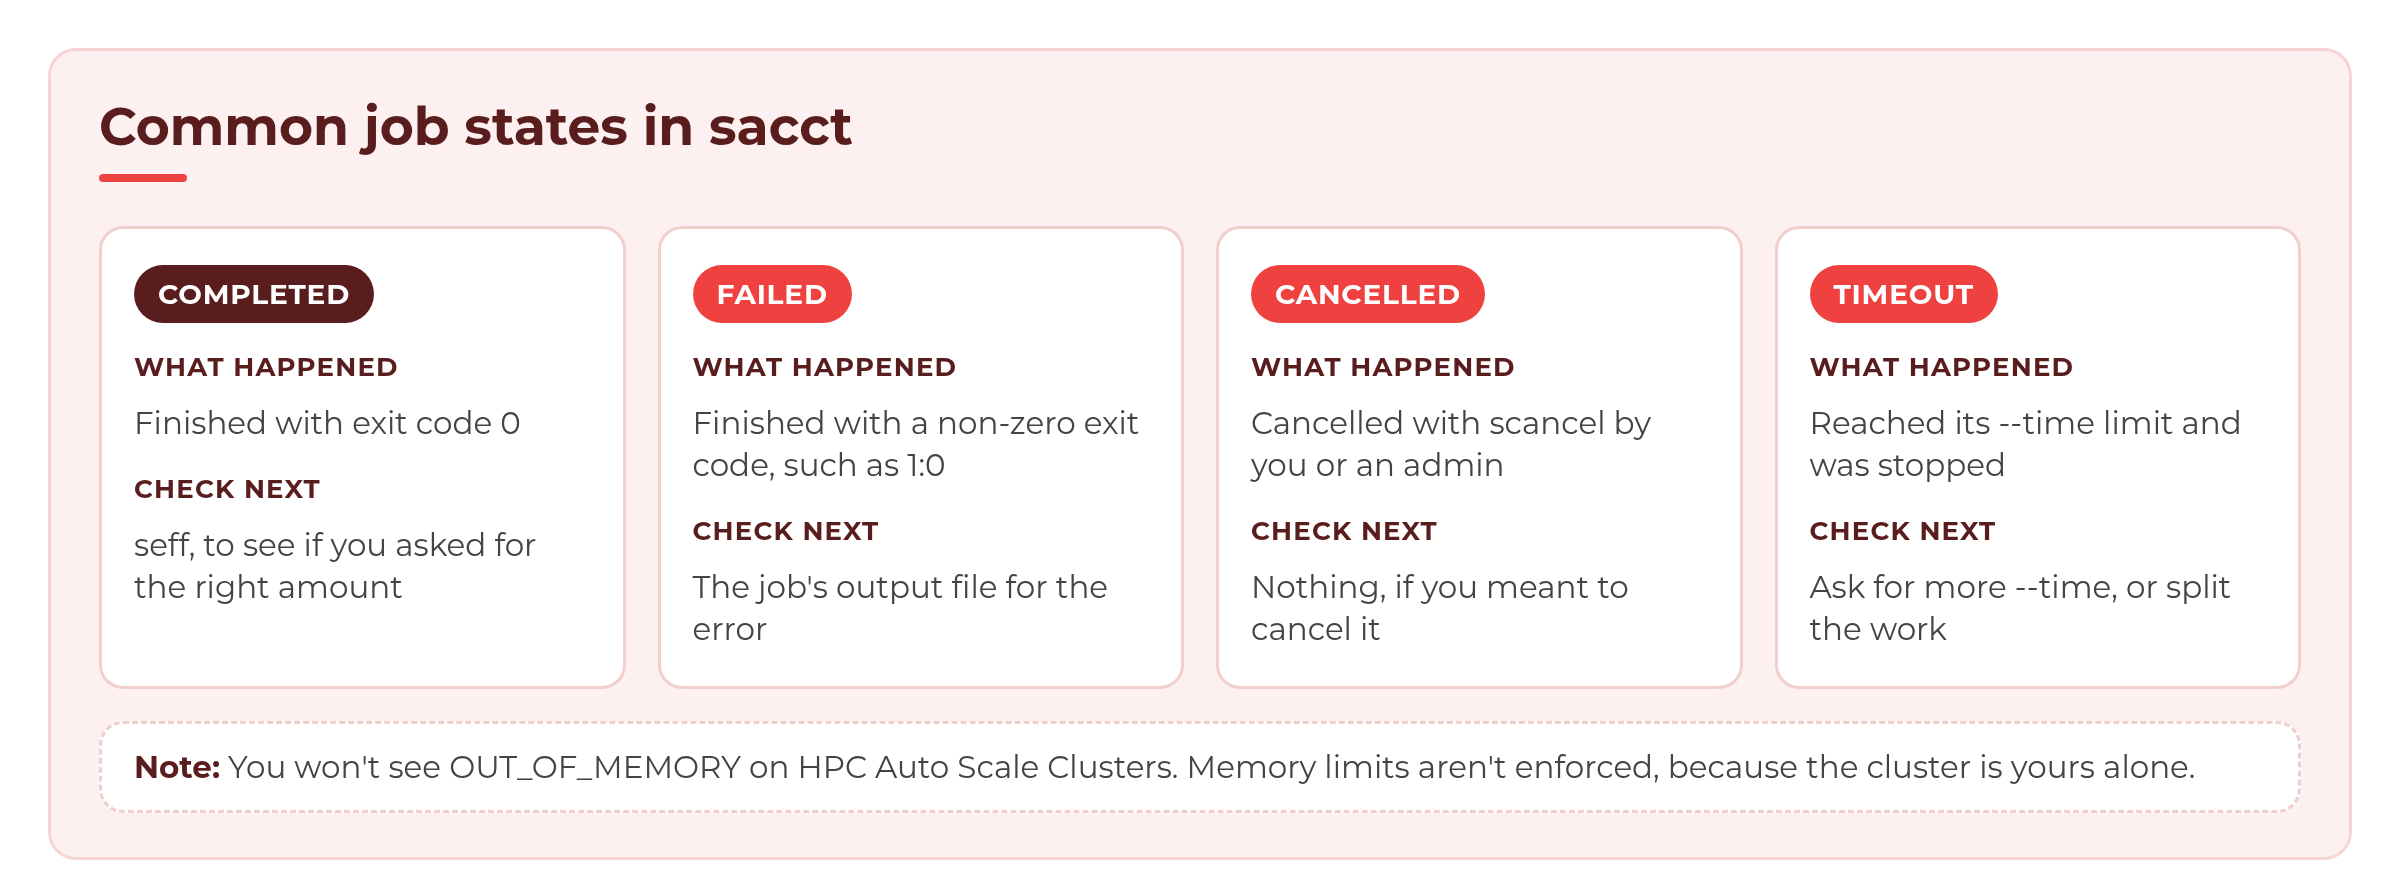
The ExitCode column shows two numbers separated by a colon: the exit code your script returned, then the signal (if any) that stopped it (e.g. a Slurm cancellation signal).
#SBATCH --time to your scripts, and your jobs won't end with a TIMEOUT state just because they ran long. You'll only see TIMEOUT if you choose to set a time limit yourself, for example with --time to stop a runaway job, and the job runs past it.Pick your columns and filter your jobs
Add these flags to sacct to see just what you need. You can combine them too.
--formatpicks the columns, for example--format=JobID,JobName%15,ReqMem,MaxRSS,State. A width like %15 stops values being cut off. Runsacct --helpformatto list every column.--units=Mshows memory in MB instead of K.-jlooks up particular jobs, for example-j 12or-j 12,2,11.-Sand-Eset a start and end time, for example-S 2026-10-29T05:30:00 -E 2026-10-29T05:35:00, or words liketoday,midnightandnow. sacct shows every job that was running at any point in that window. Times are in the cluster's time zone.--stateshows only jobs in the states you list, for example--state=FAILED,TIMEOUT,CANCELLED. Always add an end time such as-E now, or the list usually comes back empty.-Xshows one line per job and hides the step lines. It's the tidiest way to scan a day's work, but MaxRSS is blank and TotalCPU shows 00:00:00, because those numbers come from the steps.
Here is a good everyday set of columns, for jobs 12 (well-sized), 2 (over-asked) and 11 (right-sized, from Step 3):
sacct -j 12,2,11 --units=M --format=JobID,JobName%15,AllocCPUS,ReqMem,MaxRSS,Elapsed,TotalCPU,State,NodeListJobID JobName AllocCPUS ReqMem MaxRSS Elapsed TotalCPU State NodeList
------------ --------------- ---------- ---------- ---------- ---------- ---------- ---------- ---------------
2 over-asked 2 6144M 00:02:30 02:30.252 COMPLETED ip-10-255-2-6
2.batch batch 2 314.72M 00:02:30 02:30.252 COMPLETED ip-10-255-2-6
11 right-sized 1 512M 00:02:30 02:30.104 COMPLETED ip-10-255-2-8
11.batch batch 1 315.02M 00:02:30 02:30.104 COMPLETED ip-10-255-2-8
12 well-sized 2 1024M 00:02:31 04:59.563 COMPLETED ip-10-255-2-5
12.batch batch 2 12.12M 00:02:31 00:00.016 COMPLETED ip-10-255-2-5
12.0 python3 2 751.39M 00:02:30 04:59.547 COMPLETED ip-10-255-2-5 The columns that matter most:
| Column | What it shows |
|---|---|
| JobID | The job, a step inside it (like 12.batch) or an array task (like 7_3) |
| AllocCPUS | CPUs Slurm gave the job |
| ReqMem | Memory the job asked for |
| MaxRSS | The most memory the job used (shown on the step lines) |
| Elapsed | Wall-clock time the job ran for |
| TotalCPU | CPU time the job actually used, across all its CPUs |
| State and ExitCode | How the job ended |
| NodeList | The compute node(s) the job ran on |
These are the numbers seff uses: CPU efficiency is TotalCPU divided by Elapsed × AllocCPUS, and memory efficiency is MaxRSS divided by ReqMem.
--mem tells Slurm how much memory to set aside when it places jobs on nodes, so a job that goes over keeps running and still shows COMPLETED. But because Slurm places jobs by what they ask for, it can squeeze the other jobs on its node. oom-demo asked for 256M and reached a MaxRSS of 1037.52M (405.28% memory efficiency in seff). To spot jobs like this, compare MaxRSS with ReqMem, then raise --mem next time. For oom-demo, --mem=1500M would give it room.Step 5: Find out why a job failed
When a job doesn't end the way you expected, two things tell you what happened. Its state and exit code, which you met in Step 4, tell you that it failed. Its output file usually tells you why.
fail-demo did 30 seconds of work, then tried to read a file that was not there. seff 4 shows State: FAILED (exit code 1) at the top of its report card. The job's output file shows the reason:
cat fail-demo-4.outholding 50 MB, running 1 busy worker(s) for 30s
done
reading input file...
cat: results/input.csv: No such file or directoryYour output file's name comes from the --output line in your script. These jobs used --output=%x-%j.out, which is the job name and job ID, so job 4 wrote to fail-demo-4.out.
Array tasks work the same way. Task 7_3 failed straight away with exit code 2, and its output file says why:
cat array-demo-7_3.outtask 3 processing inputs/sample_3.txt
missing inputs/sample_3.txtTwo other states you may see:
TIMEOUT means the job ran past a time limit you set with --time. On RONIN clusters you only see this if you set a limit yourself (see the TIMEOUT note in Step 4). The output file ends with a line like this one from timeout-demo:
slurmstepd-ip-10-255-2-8: error: *** JOB 5 ON ip-10-255-2-8 CANCELLED AT 2026-10-29T05:27:52 DUE TO TIME LIMIT ***To fix it, give the job a longer limit, leave --time out, or split the work into smaller jobs.
CANCELLED means someone ran scancel. With a wide enough State column (for example State%20), sacct shows who: "CANCELLED by 1000" means the user with ID 1000, which is the default ubuntu user.
--state flag from Step 4, for example sacct -X -S today -E now --state=FAILED,TIMEOUT,CANCELLED,OUT_OF_MEMORY.Troubleshooting
sacct shows nothing. With no options, sacct only shows jobs since midnight in the cluster's time zone. Add -S with an earlier date, for example -S 2026-10-01, or look up a job directly with -j and its job ID.
--state returns an empty list. Add an end time, for example -S today -E now.
MaxRSS is blank. MaxRSS appears on the step lines (.batch, .0), not the job line, and not at all with -X. A job that ends within a few seconds may also finish before its memory is checked.
seff shows 0.00% for everything. The job probably ended almost straight away, like array task 7_3 in Step 5. Check State, ExitCode and the job's output file.
Some values end in +. The column is too narrow. Add a width, for example JobName%15 or State%20.
See the whole picture with Grafana
sacct and seff give you stats for each job: what it asked for, what it used and how it ended. Grafana shows you activity for each node in your cluster. Together, they build the whole picture: Grafana shows what each node is doing, and sacct and seff show which jobs ran there and whether their requests were the right size.
To find out how to use them, read How to Use Grafana Dashboards on Your HPC Auto Scale Cluster.
Wrapping up
You now know how to get a report card for any job with seff, dig into the details with sacct, and find out why a job failed. Most importantly, you can turn that report card into a better request for your next job.
If your jobs are consistently too big (or too small) for your nodes, read Changing Compute Nodes in an HPC Auto Scale Cluster. For the full tour of what is new, see Meet the New HPC Auto Scale Clusters.
Ask for what you need, check what you used, and your next job will start sooner and run more cost-efficiently.