
How to Use Grafana Dashboards on Your HPC Auto Scale Cluster
Open the Grafana dashboard built into your HPC Auto Scale Cluster with RONIN LINK, tour the main panels, run a test job and watch your cluster scale.



You have submitted a big job to your cluster. The queue says it is running. But is it really using all those CPUs you are paying for, or is it sitting there waiting on a single thread? And is /data about to fill up halfway through?
Every new HPC Auto Scale Cluster in RONIN comes with Grafana dashboards built in, so you do not have to guess. In this tutorial, we will open your cluster's dashboard through RONIN LINK, take a tour of the main panels, run a small test job and watch the cluster respond.
This guide is for researchers who are new to Grafana. No monitoring experience needed. If you have not met the new clusters yet, start with Meet the New HPC Auto Scale Clusters and if you want to see per-job stats check out What Did My Job Actually Use? Slurm Accounting with sacct and seff on Your HPC Auto Scale Cluster.
How it works
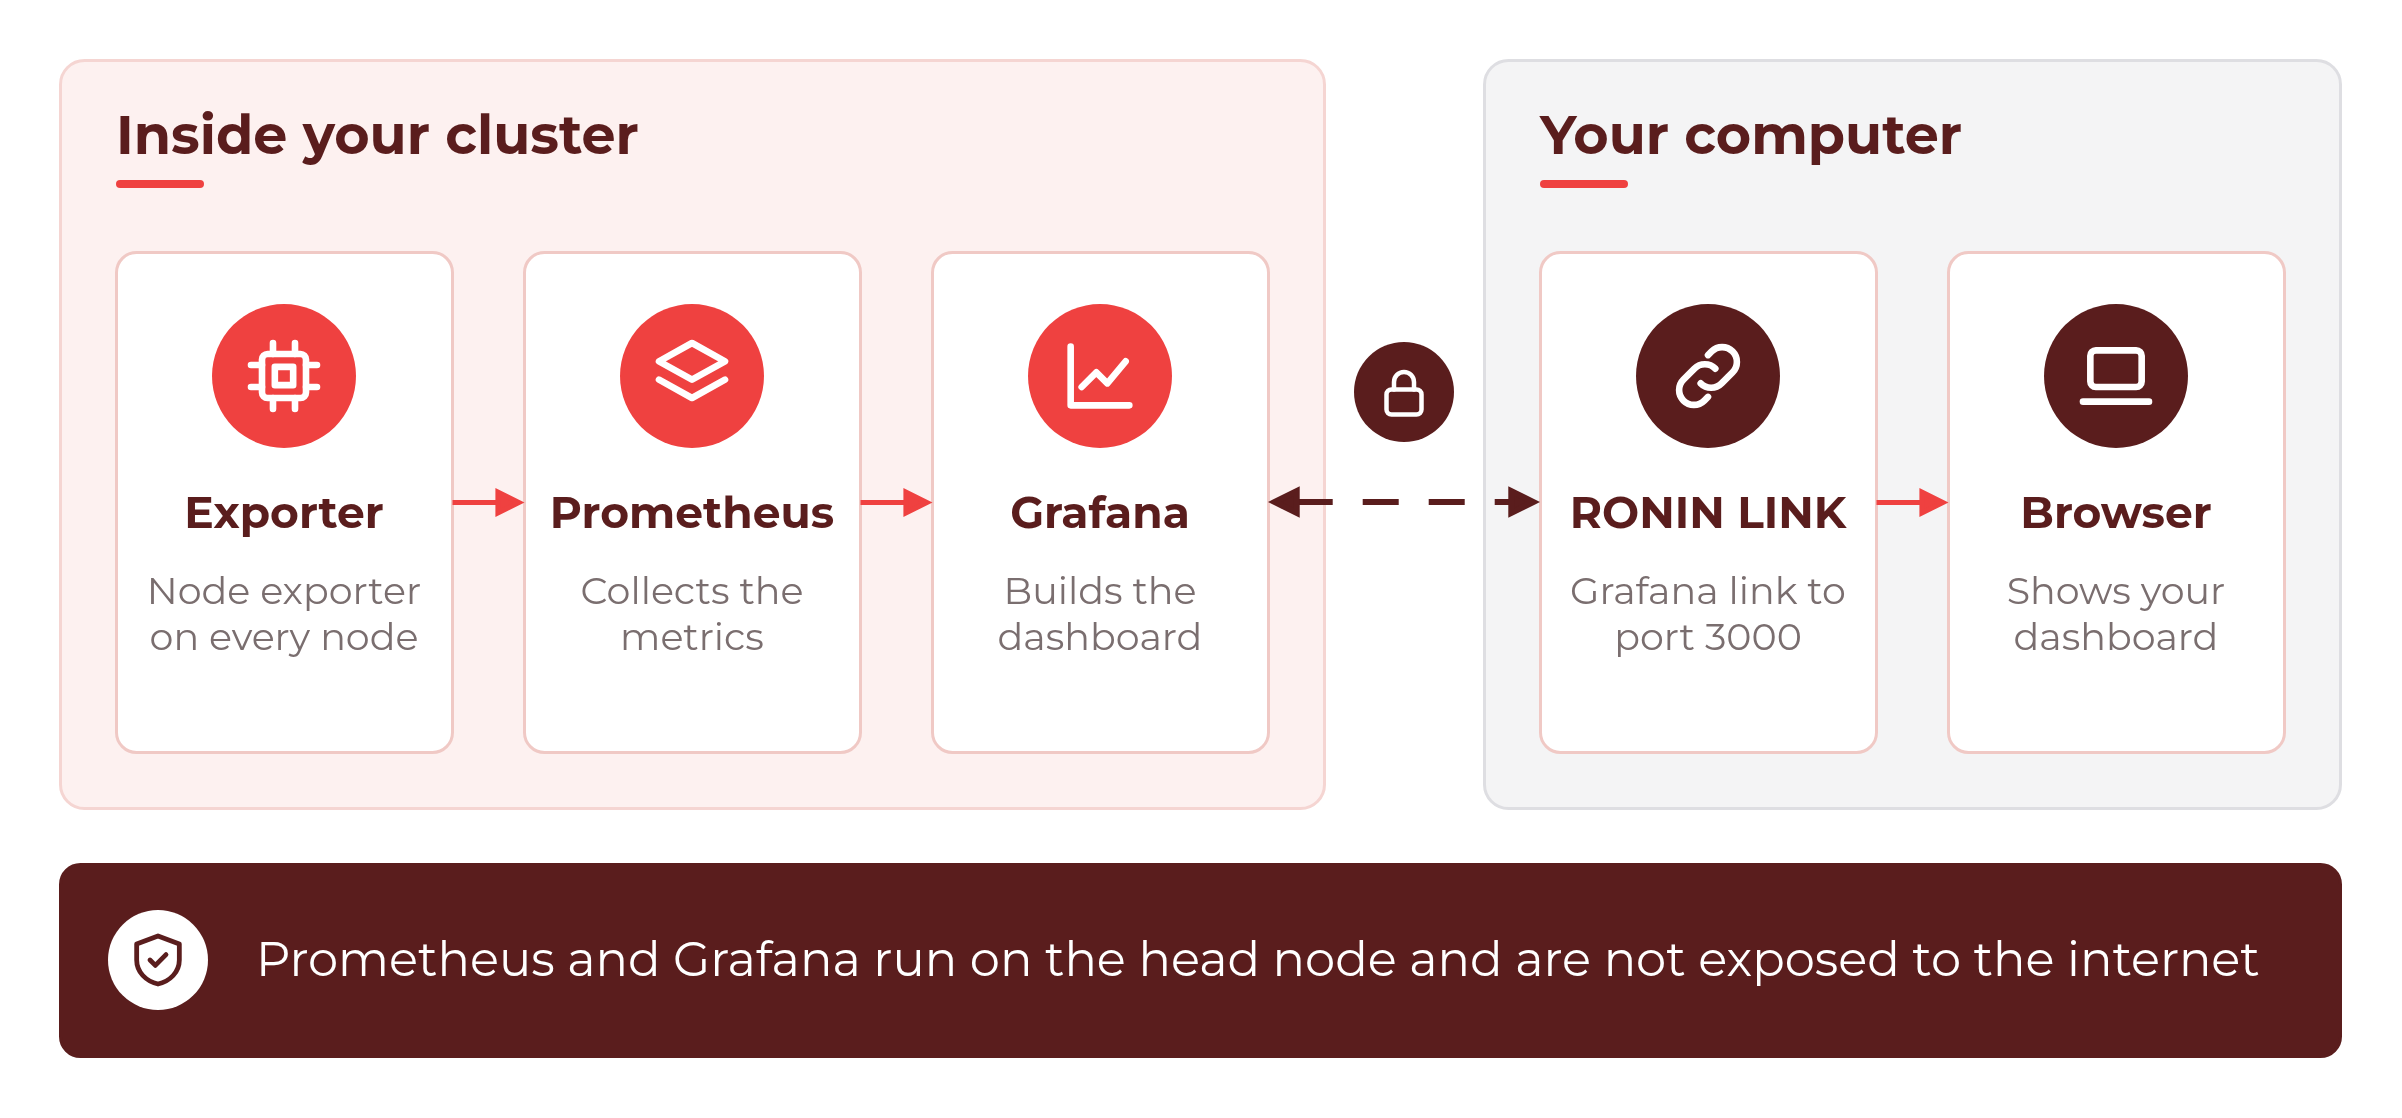
Grafana is a tool for drawing live charts from metrics. On your cluster:
- A small agent called node exporter runs on every node and reports CPU, memory, disk and network figures.
- Prometheus, on the head node, collects those figures from every node.
- Grafana, also on the head node, turns them into a dashboard.
Prometheus and Grafana are not exposed to the internet. To see the dashboard, RONIN LINK creates a secure link from your computer to Grafana on port 3000 of your cluster's head node.
Before you begin
You will need:
- A running HPC Auto Scale Cluster. Any size will do. A cluster with Min nodes set to 0 is perfect for this tutorial.
- RONIN LINK installed on your computer. Use the latest version. If you do not have it yet, grab it from the RONIN LINK page.
- Your cluster's SSH key in your Downloads or .ssh folder, so RONIN LINK can find it.
- Access to the cluster in your RONIN project (anyone in the project can open its clusters, just like machines).
💡 Tip: Your cluster keeps the same address when you stop and start it, so RONIN LINK can always find it by name.
Step 1: Connect to your cluster with RONIN LINK
In RONIN, go to your project's Auto Scale Clusters and click your cluster to open its Cluster Summary. On the Info tab you will see your cluster's address (for example blog-demo.hpc.ronin.cloud) and an OPEN IN RONIN LINK button.
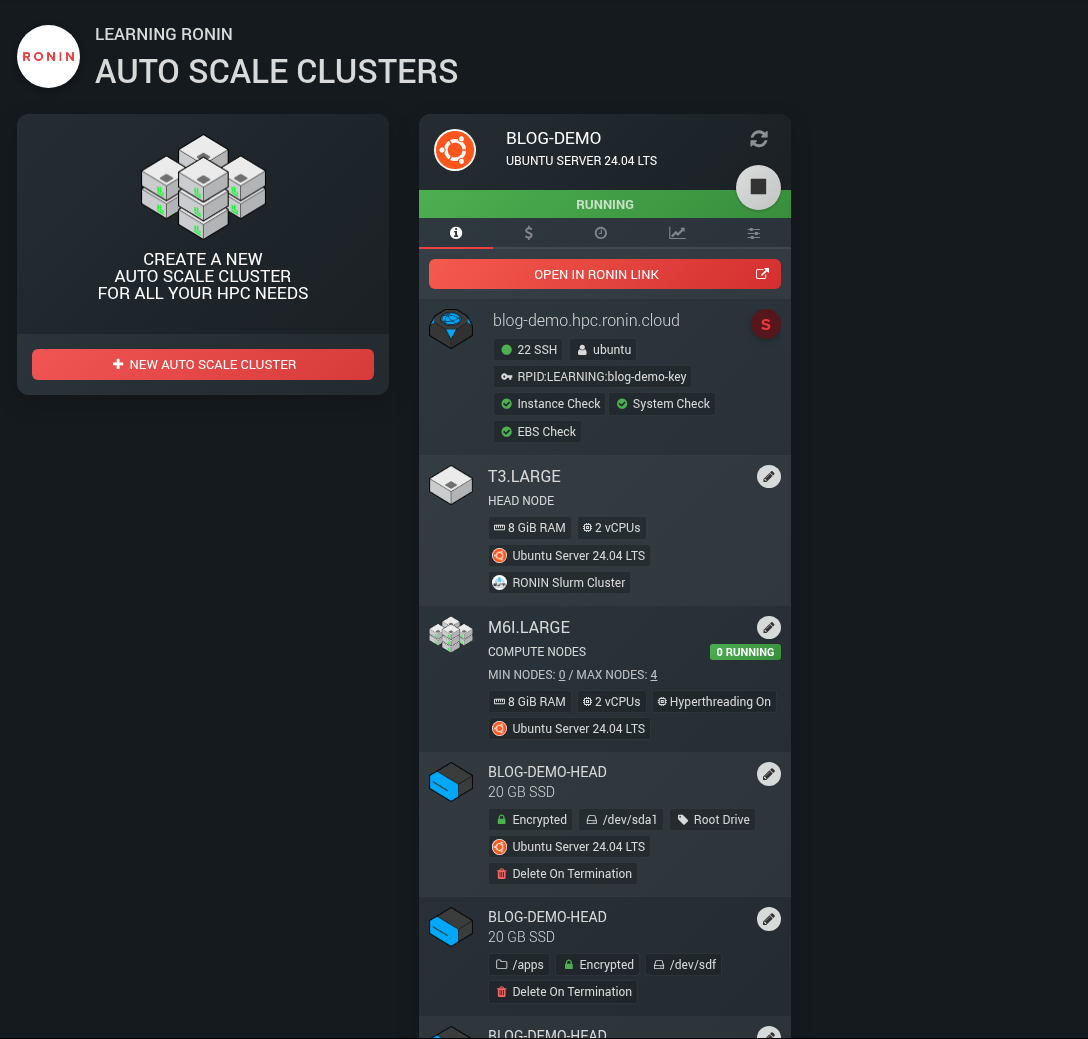
Click OPEN IN RONIN LINK. RONIN LINK opens with your cluster already selected and its details filled in.
If RONIN LINK is not installed, you will see a dialog with a DOWNLOAD RONIN LINK button instead. Install it, then click OPEN IN RONIN LINK again.
Step 2: Open Grafana
In RONIN LINK:
- Click Connect to Machine on your cluster's card.
- Click GRAFANA under the Machine Monitoring section
RONIN LINK sets up a secure link to Grafana, which runs on port 3000 of your head node. You do not need to type a port number.
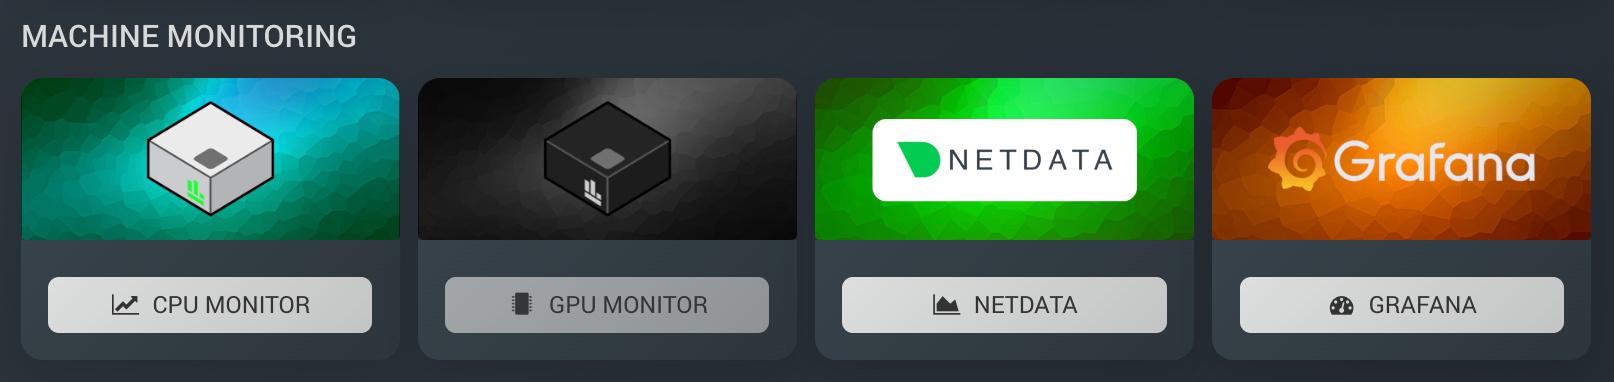
After you click LINK, RONIN LINK opens Grafana in your browser for you. There is no sign-in needed, and Grafana lands on your cluster's home dashboard. You may notice a Sign in link at the top right, but you do not need it to view your dashboard.
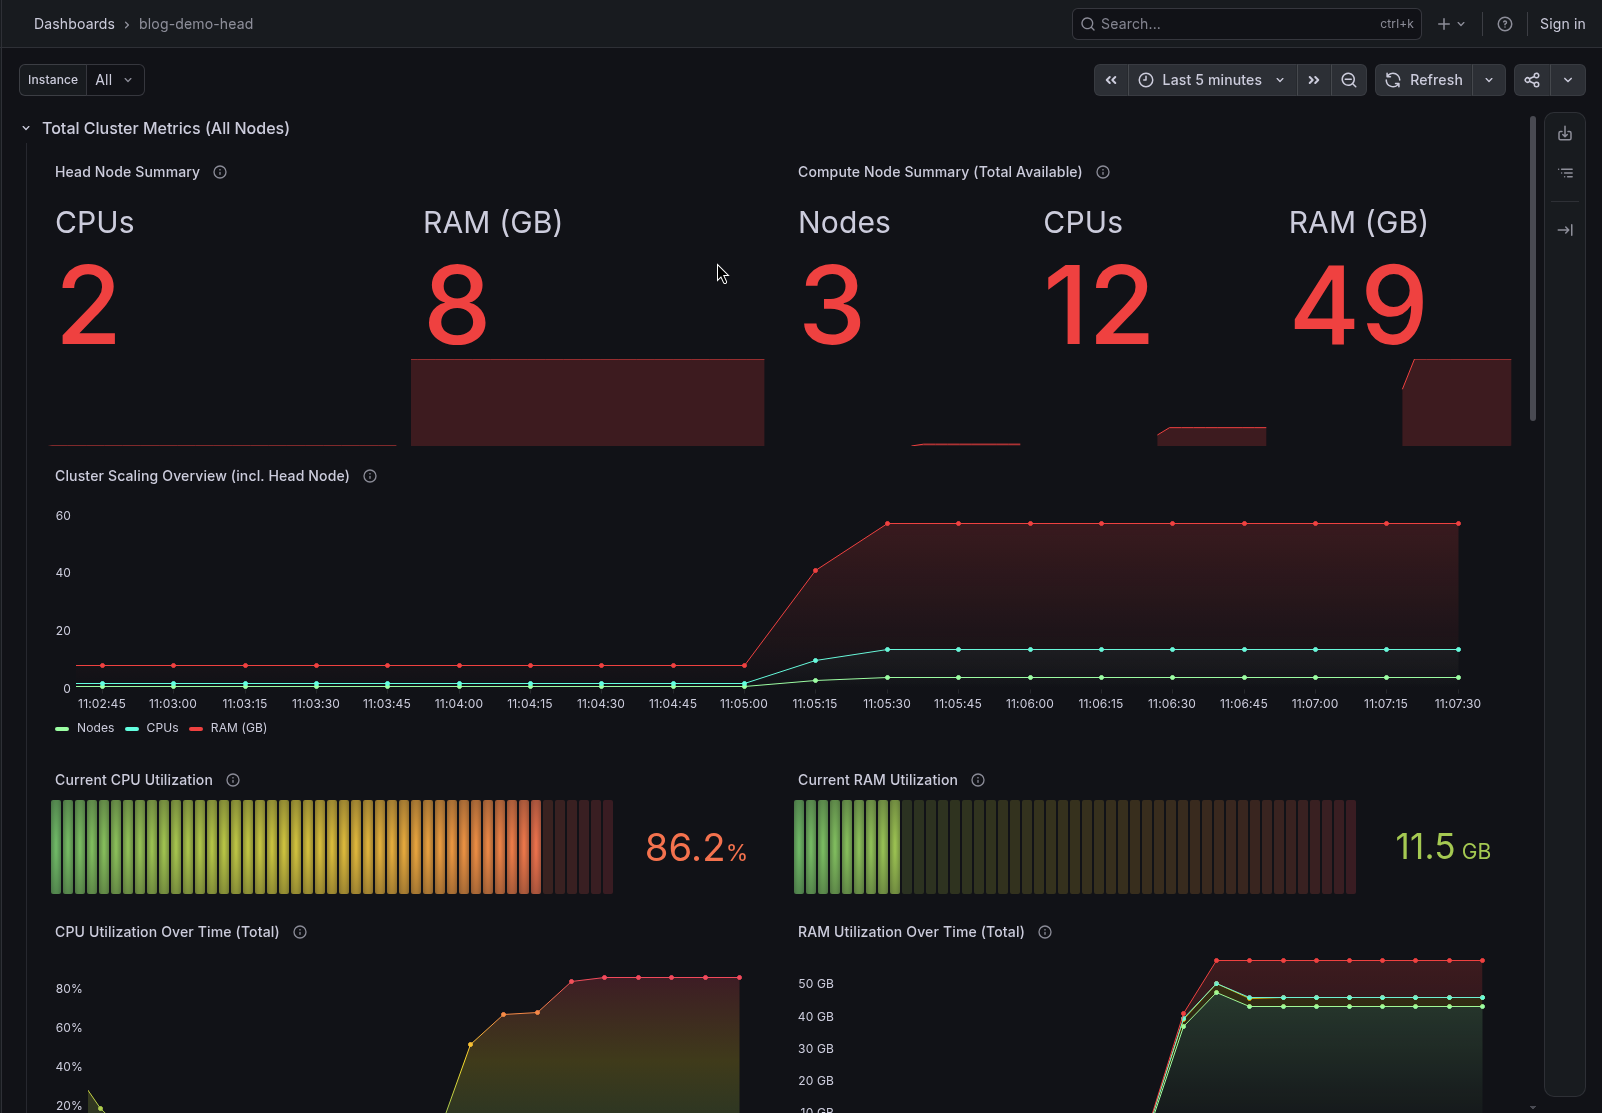
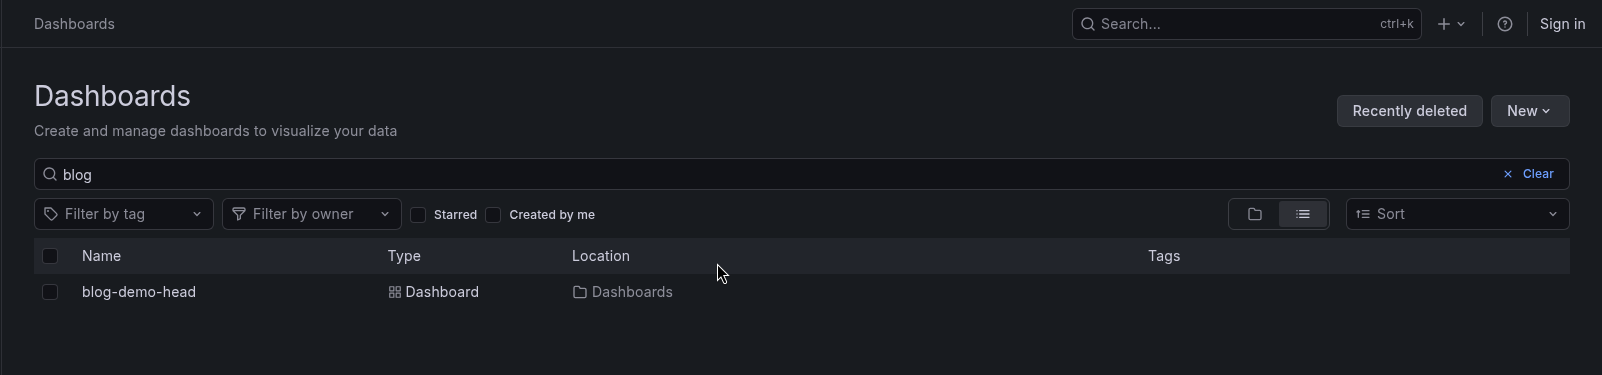
Your cluster comes with its dashboard already set up, named after your cluster and ending in -head (for example blog-demo-head). If you click away from it, open Dashboards in the Grafana menu and choose it from the list.
Step 3: Take a tour of the dashboard
The dashboard has two parts. At the top, which you saw in Step 4, the Total Cluster Metrics (All Nodes) row shows the whole cluster. Below it, per-node rows show one node at a time.
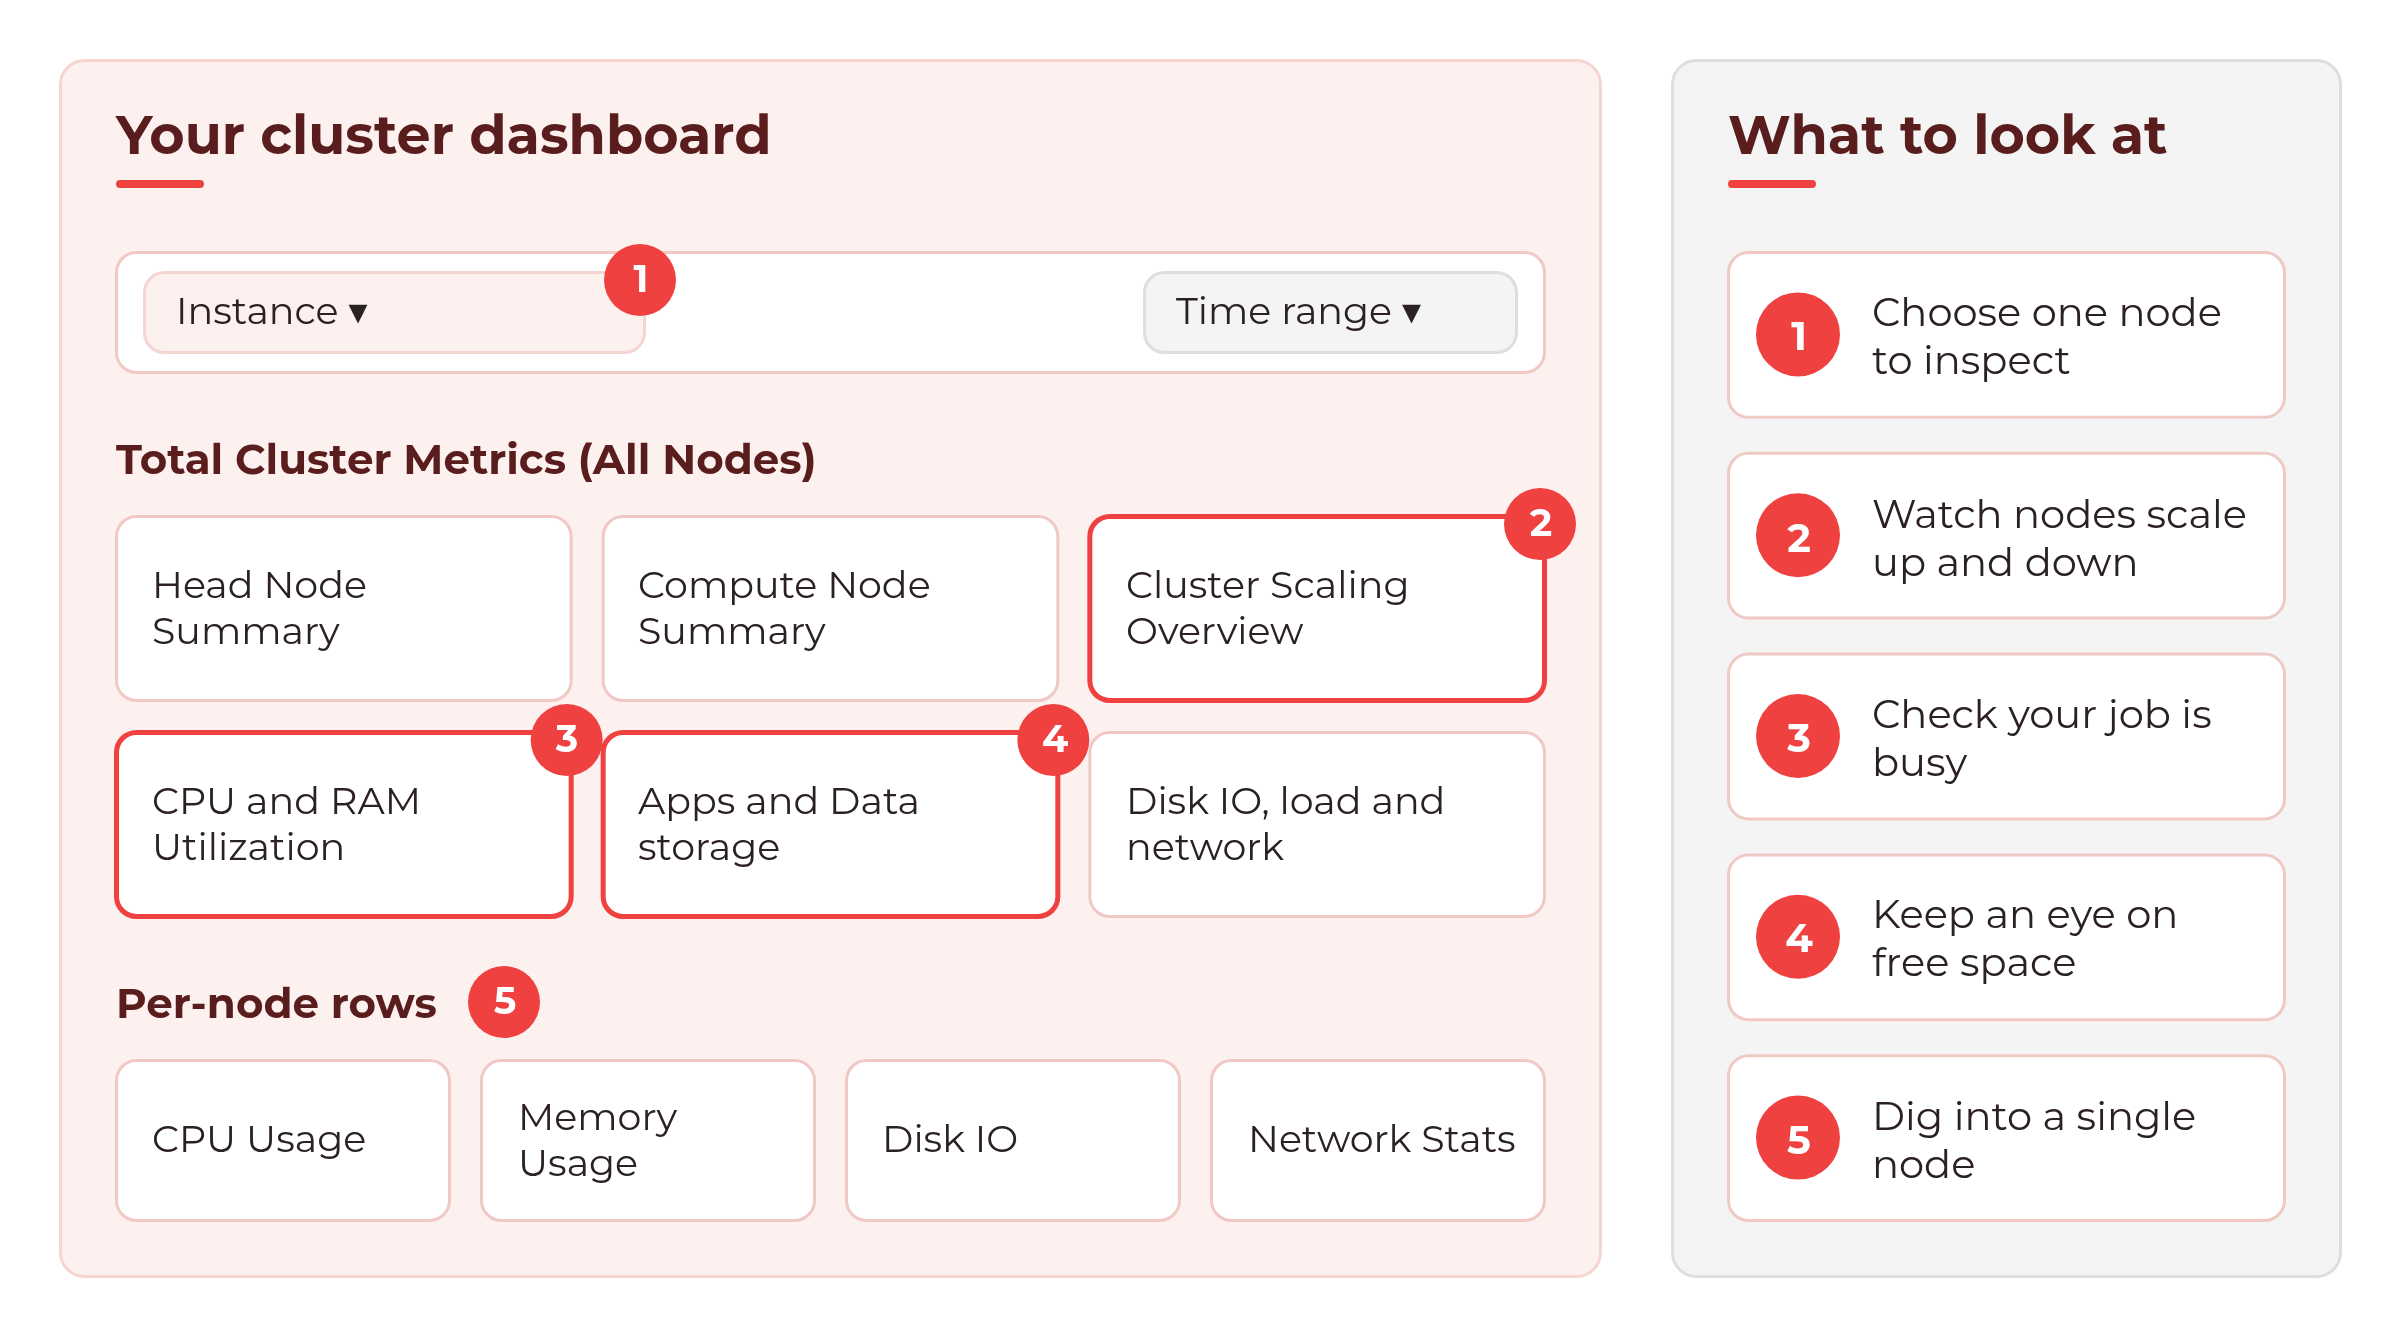
The panels you will use most:
- Head Node Summary and Compute Node Summary (Total Available) show what your nodes have to offer.
- Cluster Scaling Overview (incl. Head Node) shows how many nodes are running. Watch this go up when jobs queue and back down when they finish.
- Current CPU and RAM Utilization and CPU and RAM Utilization Over Time (Total and Per Node) show how hard your cluster is working.
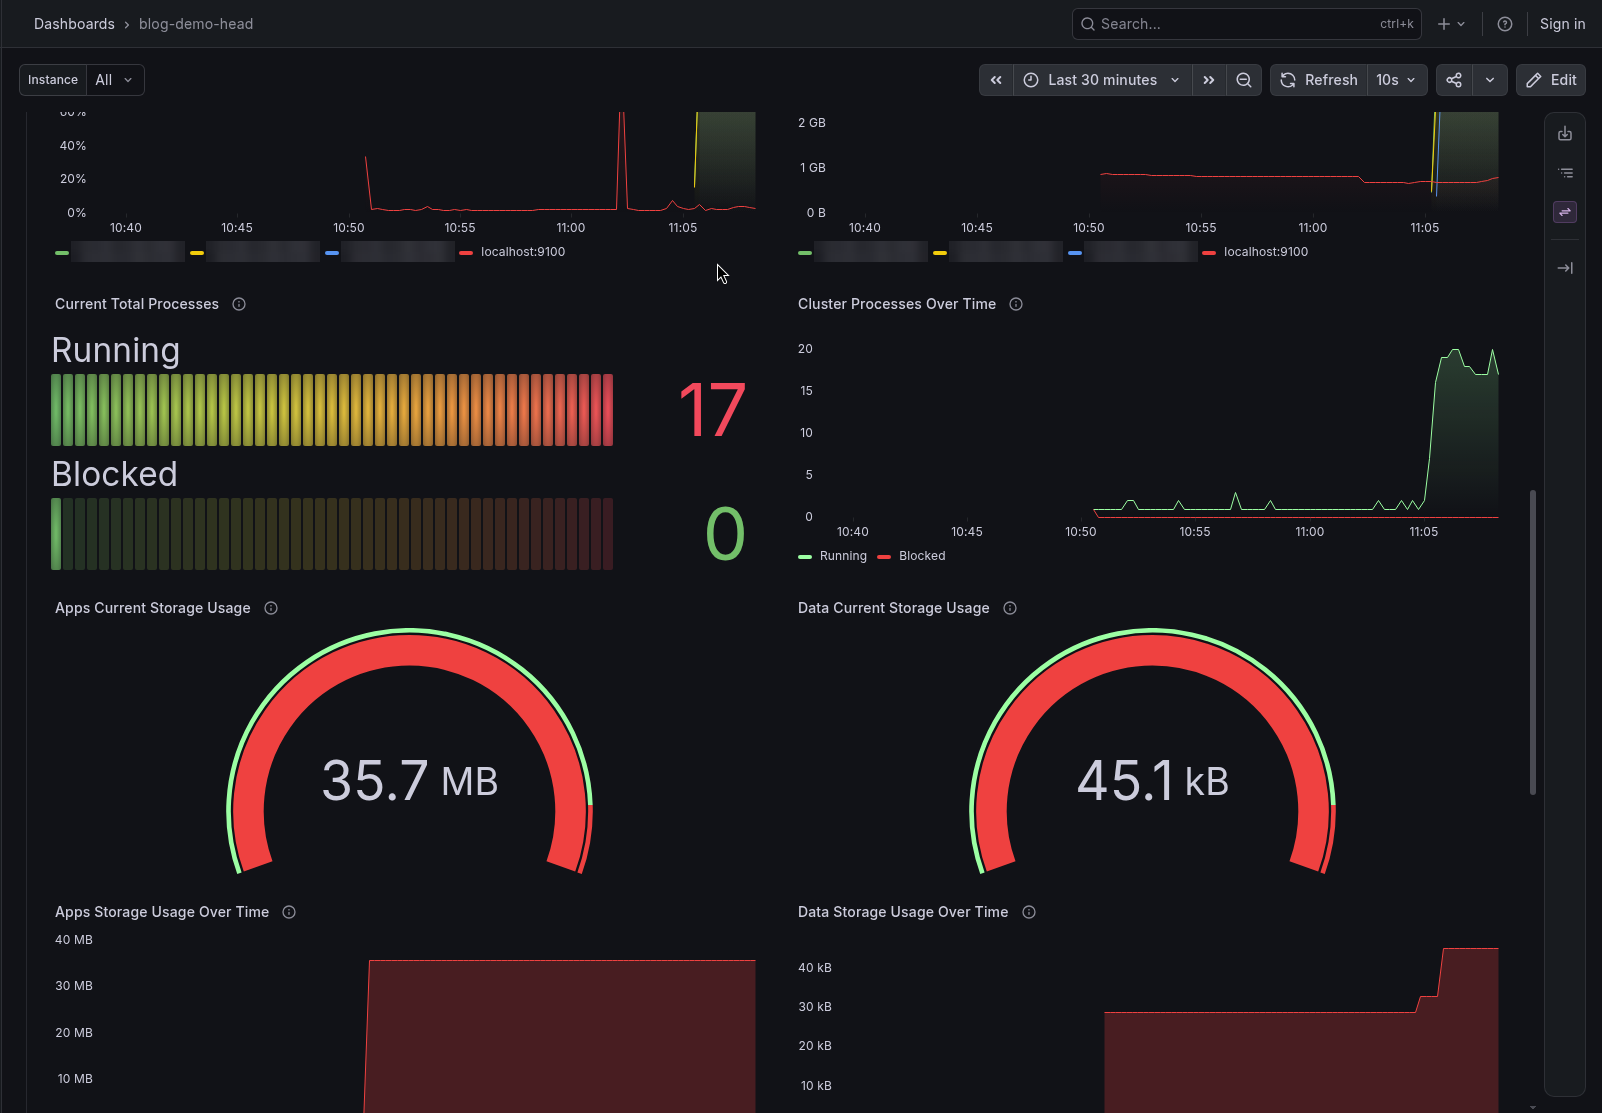
- Apps and Data Current Storage Usage shows how full your shared /apps and /data drives are.
- Cluster Disk IO, Cluster Load Average and Cluster Network Bytes help when a job seems slow.
💡 Tip: The dashboard uses US spelling, so you'll see Utilization.
Step 4: Run a test job and watch your cluster scale
Dashboards are much more fun with something happening. Let's give the cluster a job.
Open a terminal on your head node (the terminal button on your cluster's card in RONIN LINK is the quickest way). Spack comes preinstalled, so install the stress tool:
spack install stress
Create a job script:
nano stress.sh
Paste in the following and save the file. It keeps 2 CPUs busy for 5 minutes:
#!/bin/bash
#SBATCH --nodes=1
#SBATCH --cpus-per-task=2
spack load stress
stress --cpu 2 --timeout 300s --verbose
Submit a handful of copies so the cluster has a reason to scale:
sbatch -a 1-5 stress.sh
Check the queue:
squeue
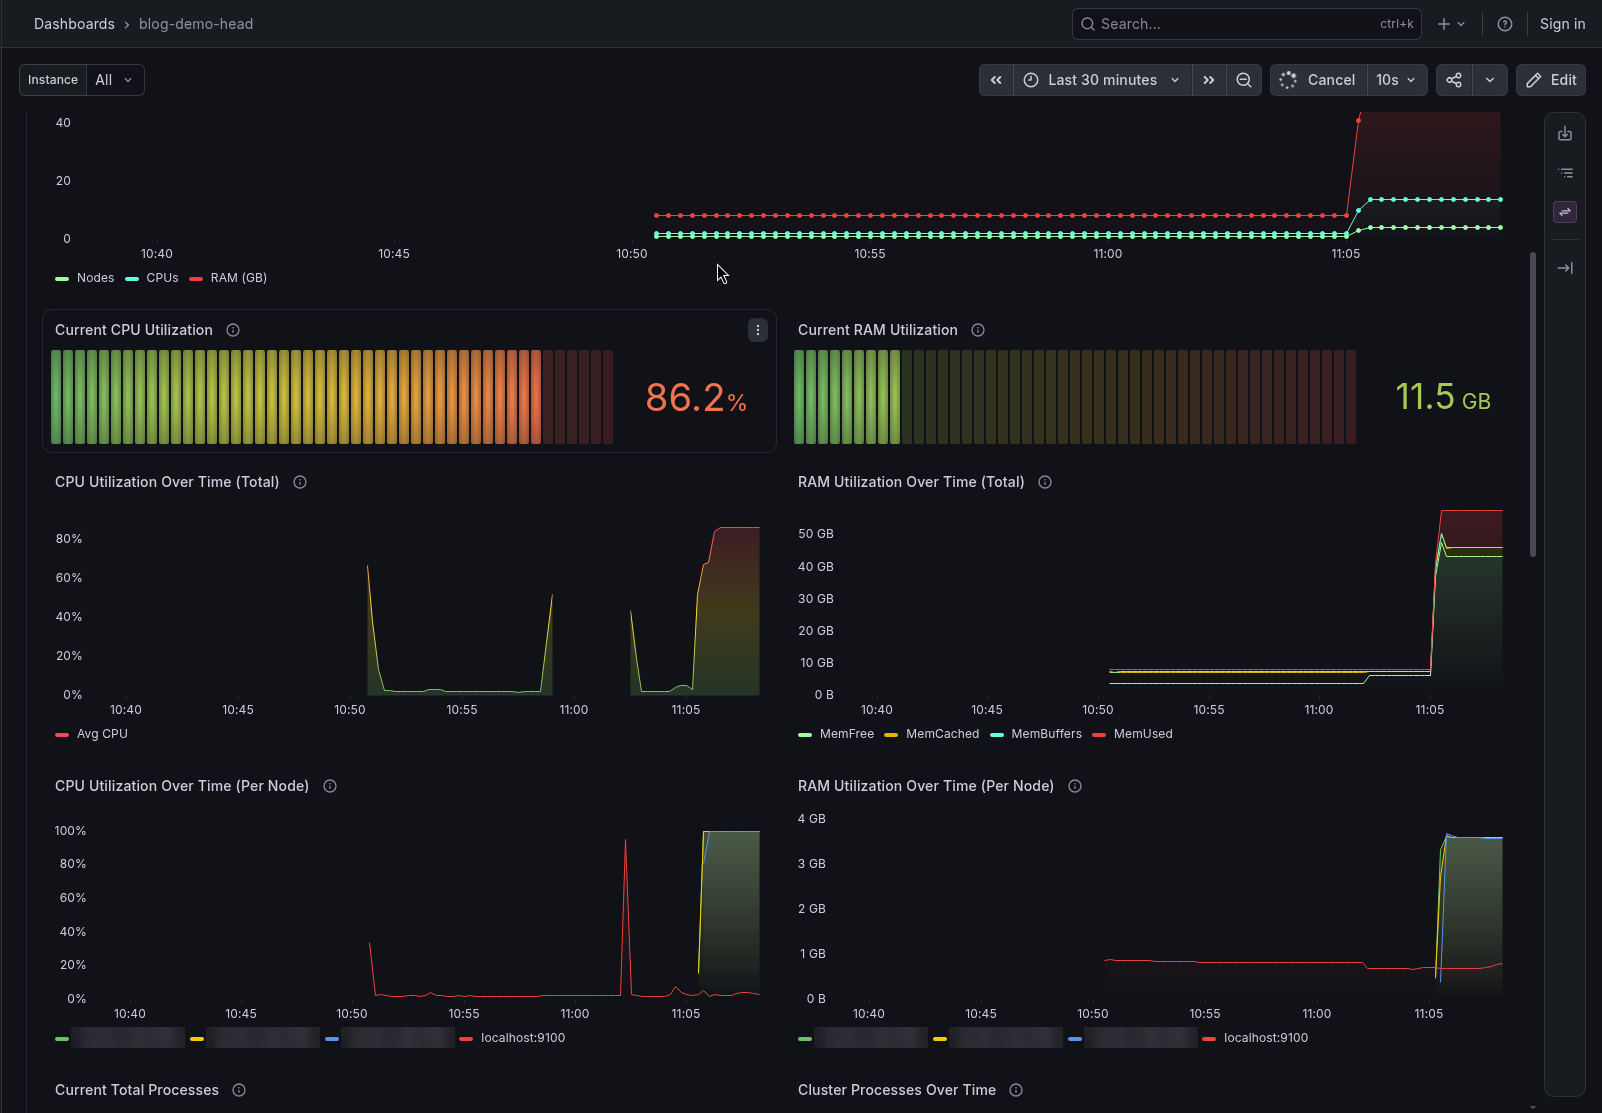
Now go back to Grafana. If your Min nodes are 0, your jobs will wait in the queue while compute nodes launch (in our testing, nodes launched and started running jobs about a minute after we submitted them but this may vary depending on the compute node type you selected). Then you will see:
- Cluster Scaling Overview step up as new nodes join.
- CPU and RAM Utilization Over Time climb as the jobs start.
- New compute nodes appear in the charts as they launch.
Step 5: Check your storage
Scroll to Apps and Data Current Storage Usage. These gauges show how full /apps (your software) and /data (your results) are. If one is getting close to full, you can increase its size from the Info tab in RONIN.
Step 6: Look at a single node
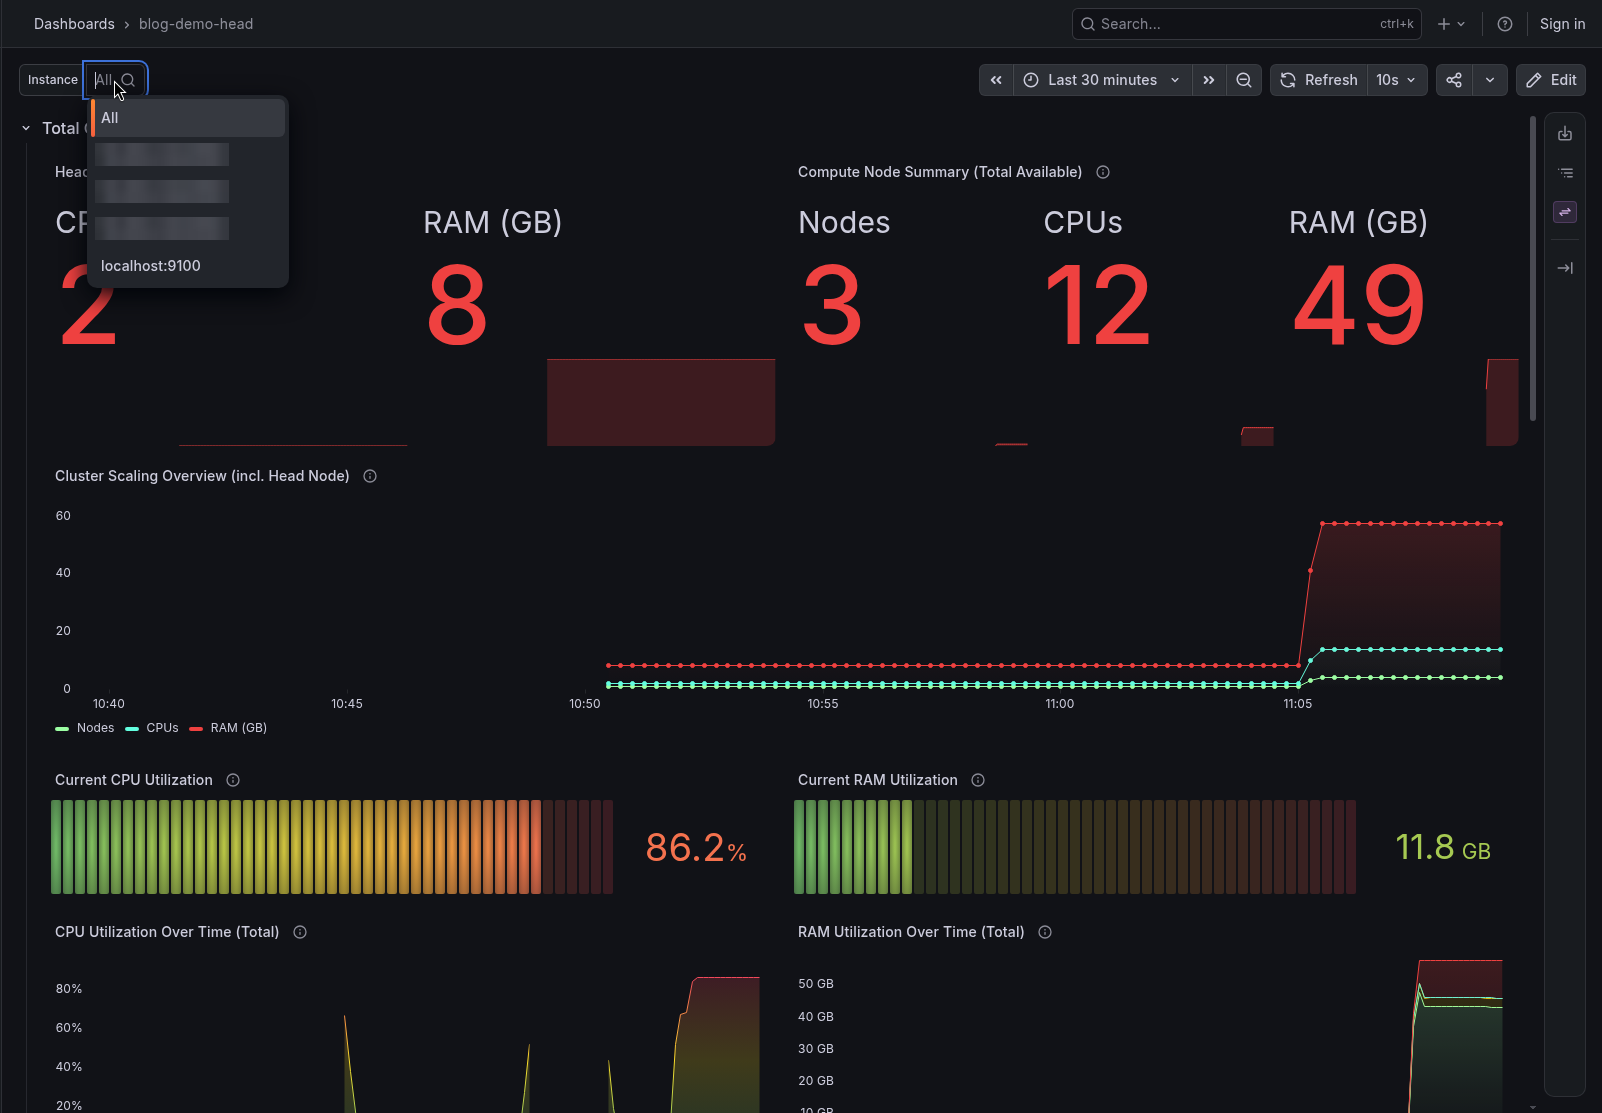
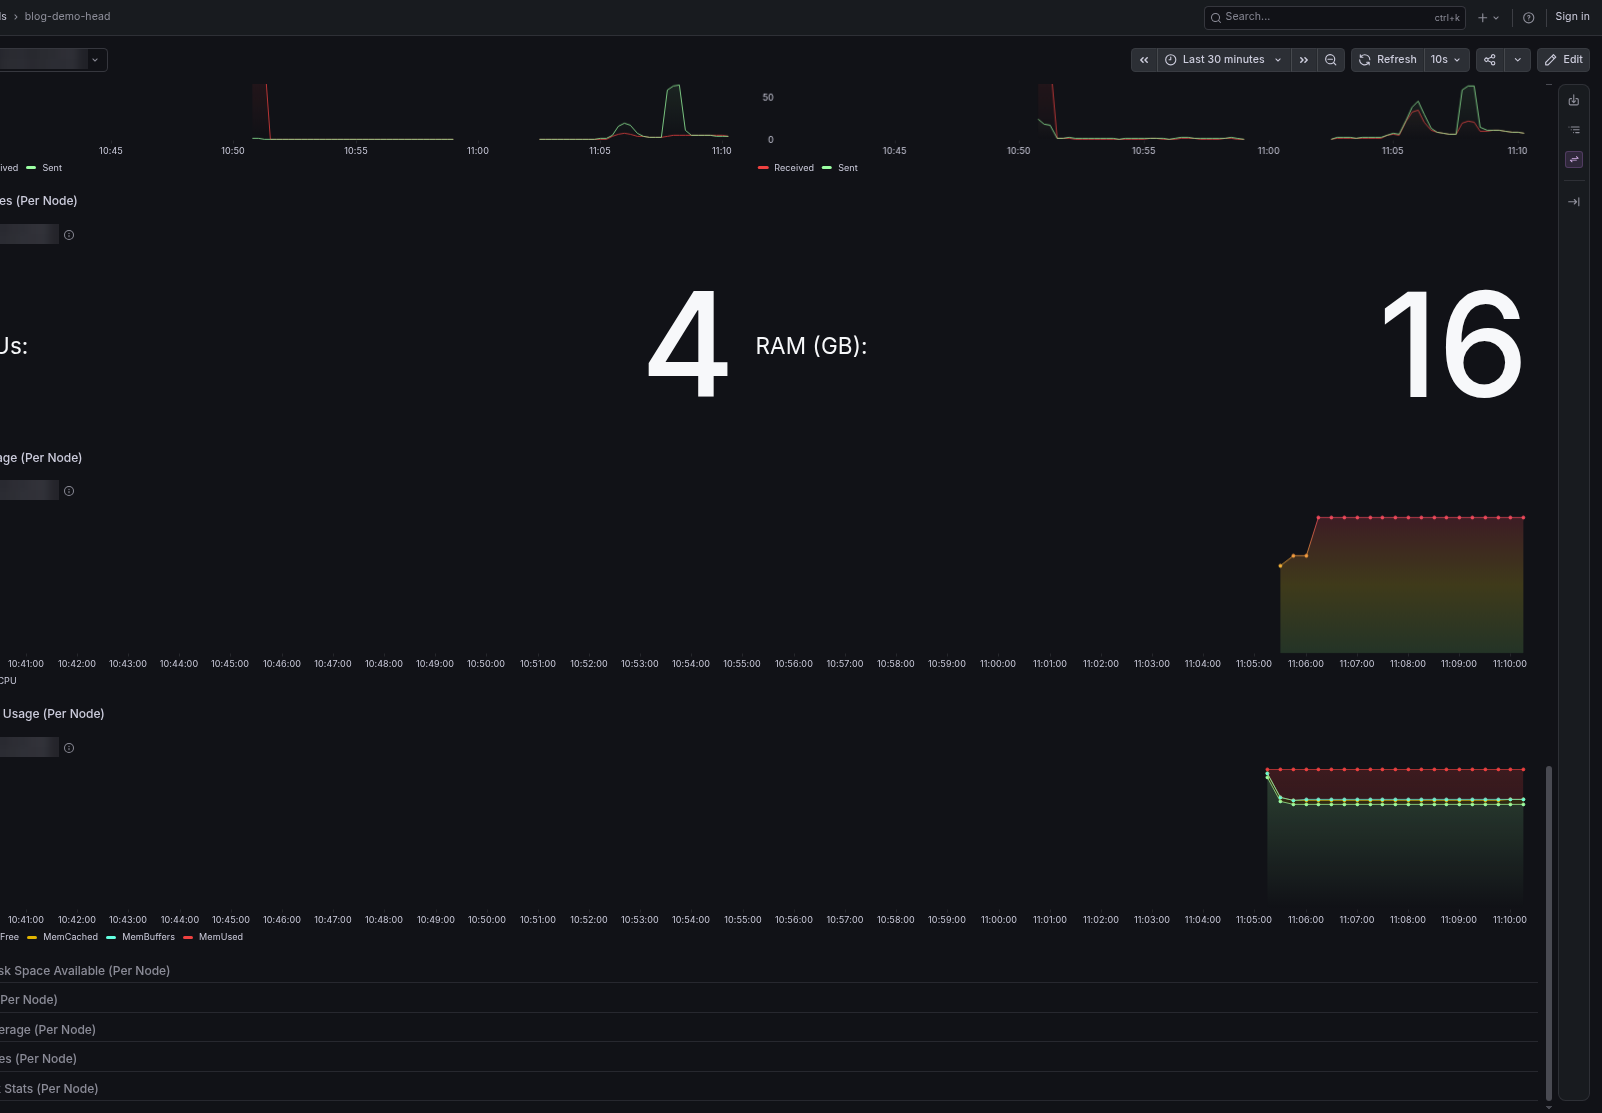
At the top of the dashboard, use the instance selector to choose one node. The per-node rows below (Resources, CPU Usage, Memory Usage, Local Disk Space Available, Disk IO, Load Average, Processes and Network Stats) now show just that node.
Each node is listed by its address. localhost:9100 is your head node.
This is handy when one job is behaving differently from the rest.
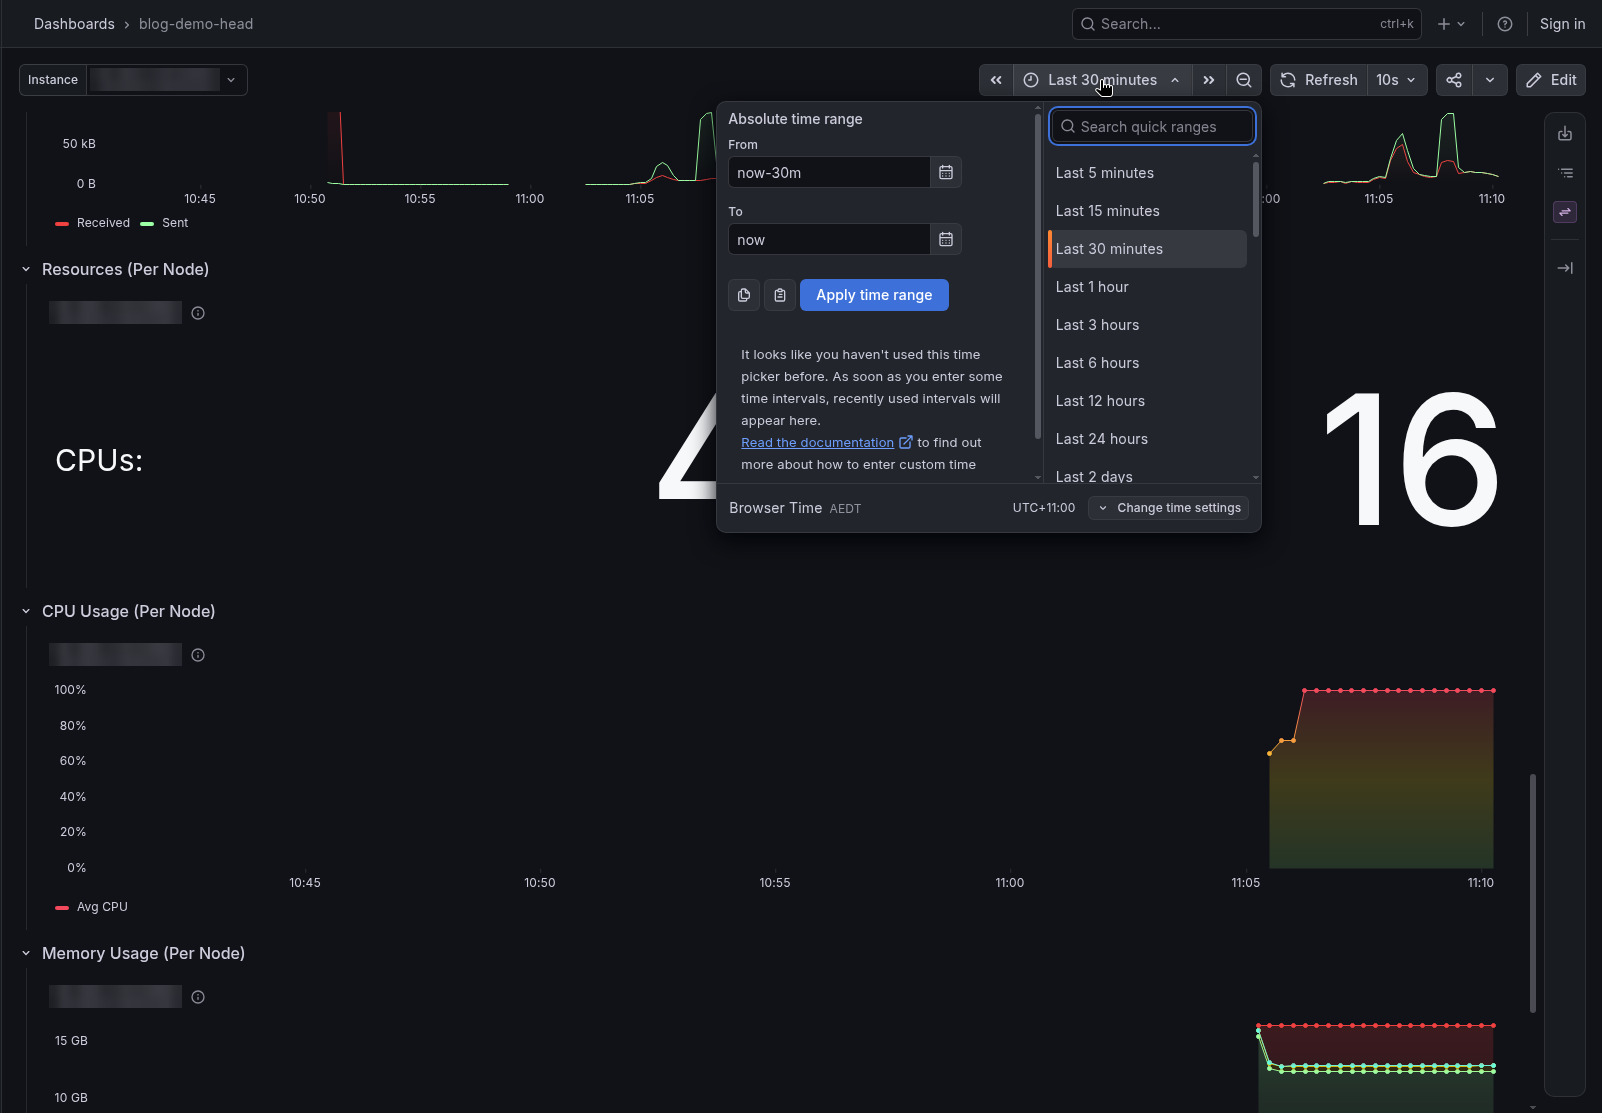
💡 Tip: Use the time range picker at the top right to zoom out over a longer run, or in on the last few minutes.
Grafana or the Metrics tab?
Your Cluster Summary in RONIN also has a Metrics tab. Both are useful, for different jobs:
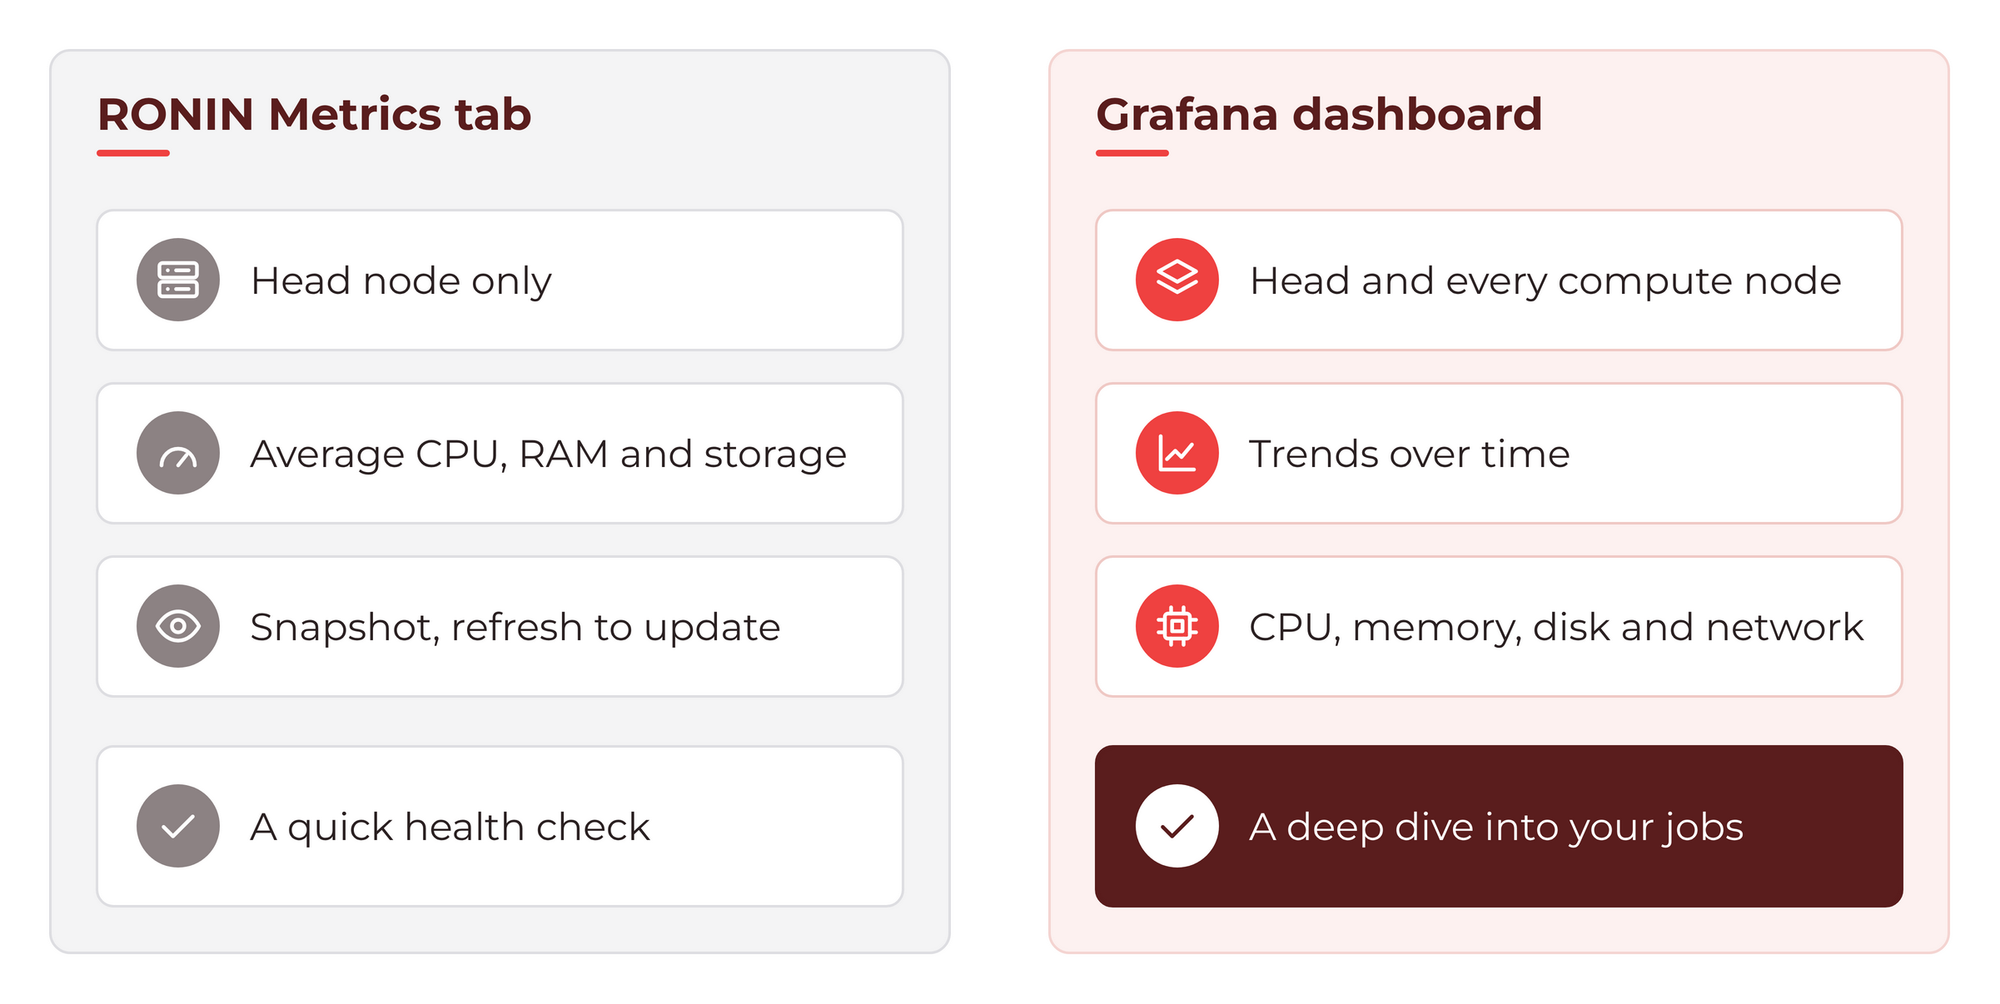
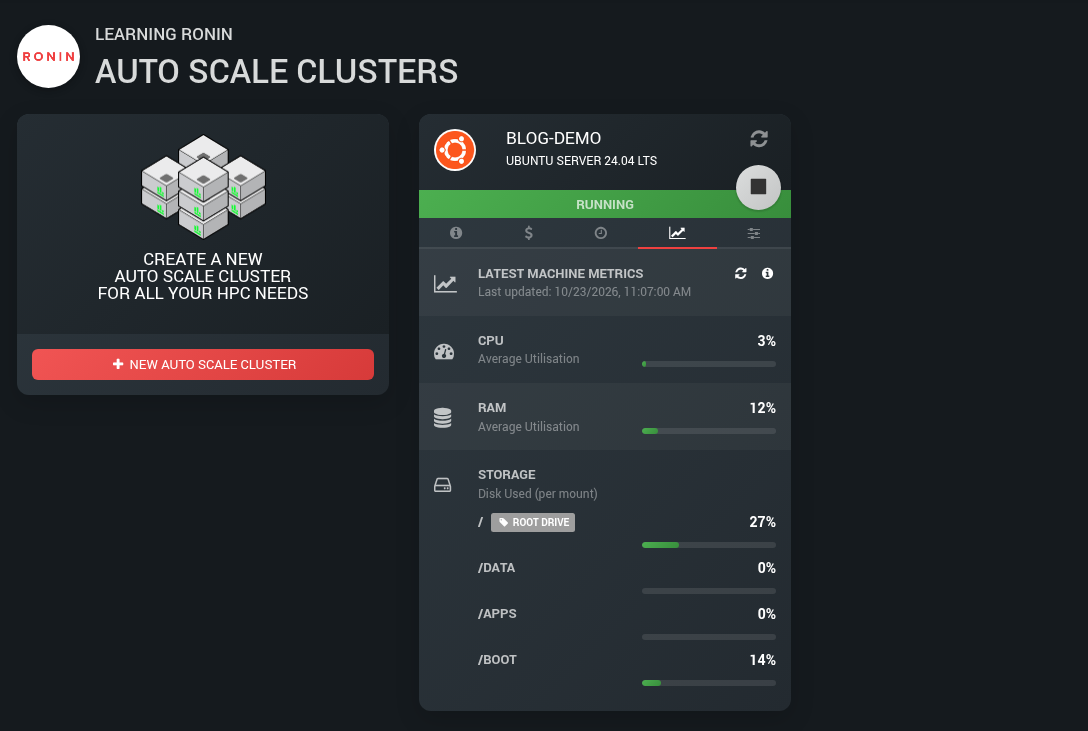
- Metrics tab: under "LATEST MACHINE METRICS", a quick look at the head node's average CPU and RAM utilisation and the disk used on each mount, right inside RONIN. Click refresh to update it.
- Grafana: the head and every compute node, with CPU, memory, disk and network over time. Use it to understand your jobs.
Troubleshooting
I can only see the head node. That is normal when no jobs are running and Min nodes is 0. Compute nodes only appear while they are running. Submit a job and they will show up.
Grafana will not load. Check that your cluster is running (not stopped) and that the Grafana link is still active in RONIN LINK. If you recently restarted the cluster, try linking Grafana again.
RONIN LINK cannot connect. Make sure the cluster's SSH key is in your Downloads or .ssh folder, or point RONIN LINK to where it is saved.
A chart looks flat. Check the time range in the top right, and give new nodes a minute or two to start reporting.
Wrapping up
You now know how to open your cluster's Grafana dashboard, what the main panels mean, and how to check that your jobs are using what you are paying for.
To see statistics for each individual job once it has finished, check out What Did My Job Actually Use? Slurm Accounting with sacct and seff on Your HPC Auto Scale Cluster. If the dashboard shows your nodes are too small (or too big) for your work, read Changing Compute Nodes in an HPC Auto Scale Cluster. For the full tour of what is new, see Meet the New HPC Auto Scale Clusters.