
Meet the New HPC Auto Scale Clusters: Native Slurm, Built-in Grafana and Clusters You Can Edit
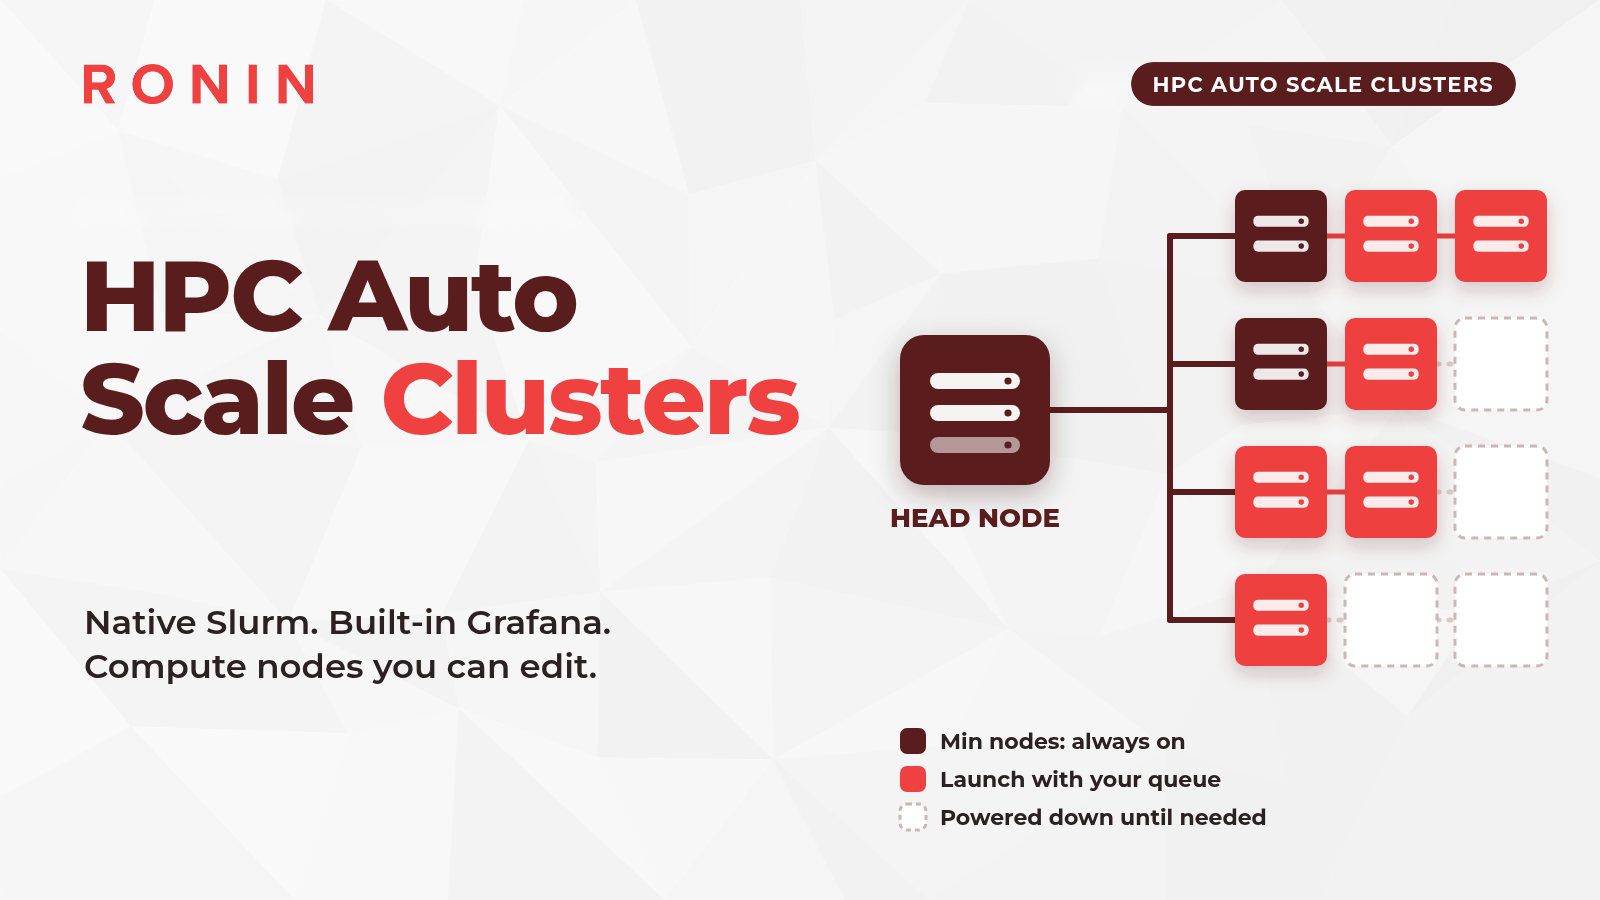
HPC Auto Scale Clusters are coming soon to RONIN with native Slurm, built-in Grafana dashboards and compute nodes you can change after launch, without starting again.



If you have ever launched a cluster, sat down to run your first big job and then realised you picked the wrong node size, this one is for you.
We have rebuilt HPC Auto Scale Clusters from the ground up, and the new version is now available on RONIN. Clusters now run native Slurm on Ubuntu 24.04, come with Grafana dashboards built in, and let you change your compute nodes after launch without starting again. Everything still scales with your jobs: the head node and your Min nodes are always on, and compute nodes beyond Min only run while there is work in the queue.
This post is a tour of what is new. It is written for users who run (or would like to run) batch jobs on a cluster, and for the research IT teams who support them.
What is an HPC Auto Scale Cluster?
A cluster is a group of machines that work together on your jobs. In RONIN, every cluster has two parts:
- A head node. This is the machine you log in to. It runs the Slurm scheduler (the software that queues your jobs and hands them out), hosts your shared /apps, /data and /home drives, and runs the cluster's monitoring.
- Compute nodes. These are the machines that actually run your jobs. They launch when jobs are waiting in the queue and shut down again when the queue is empty.
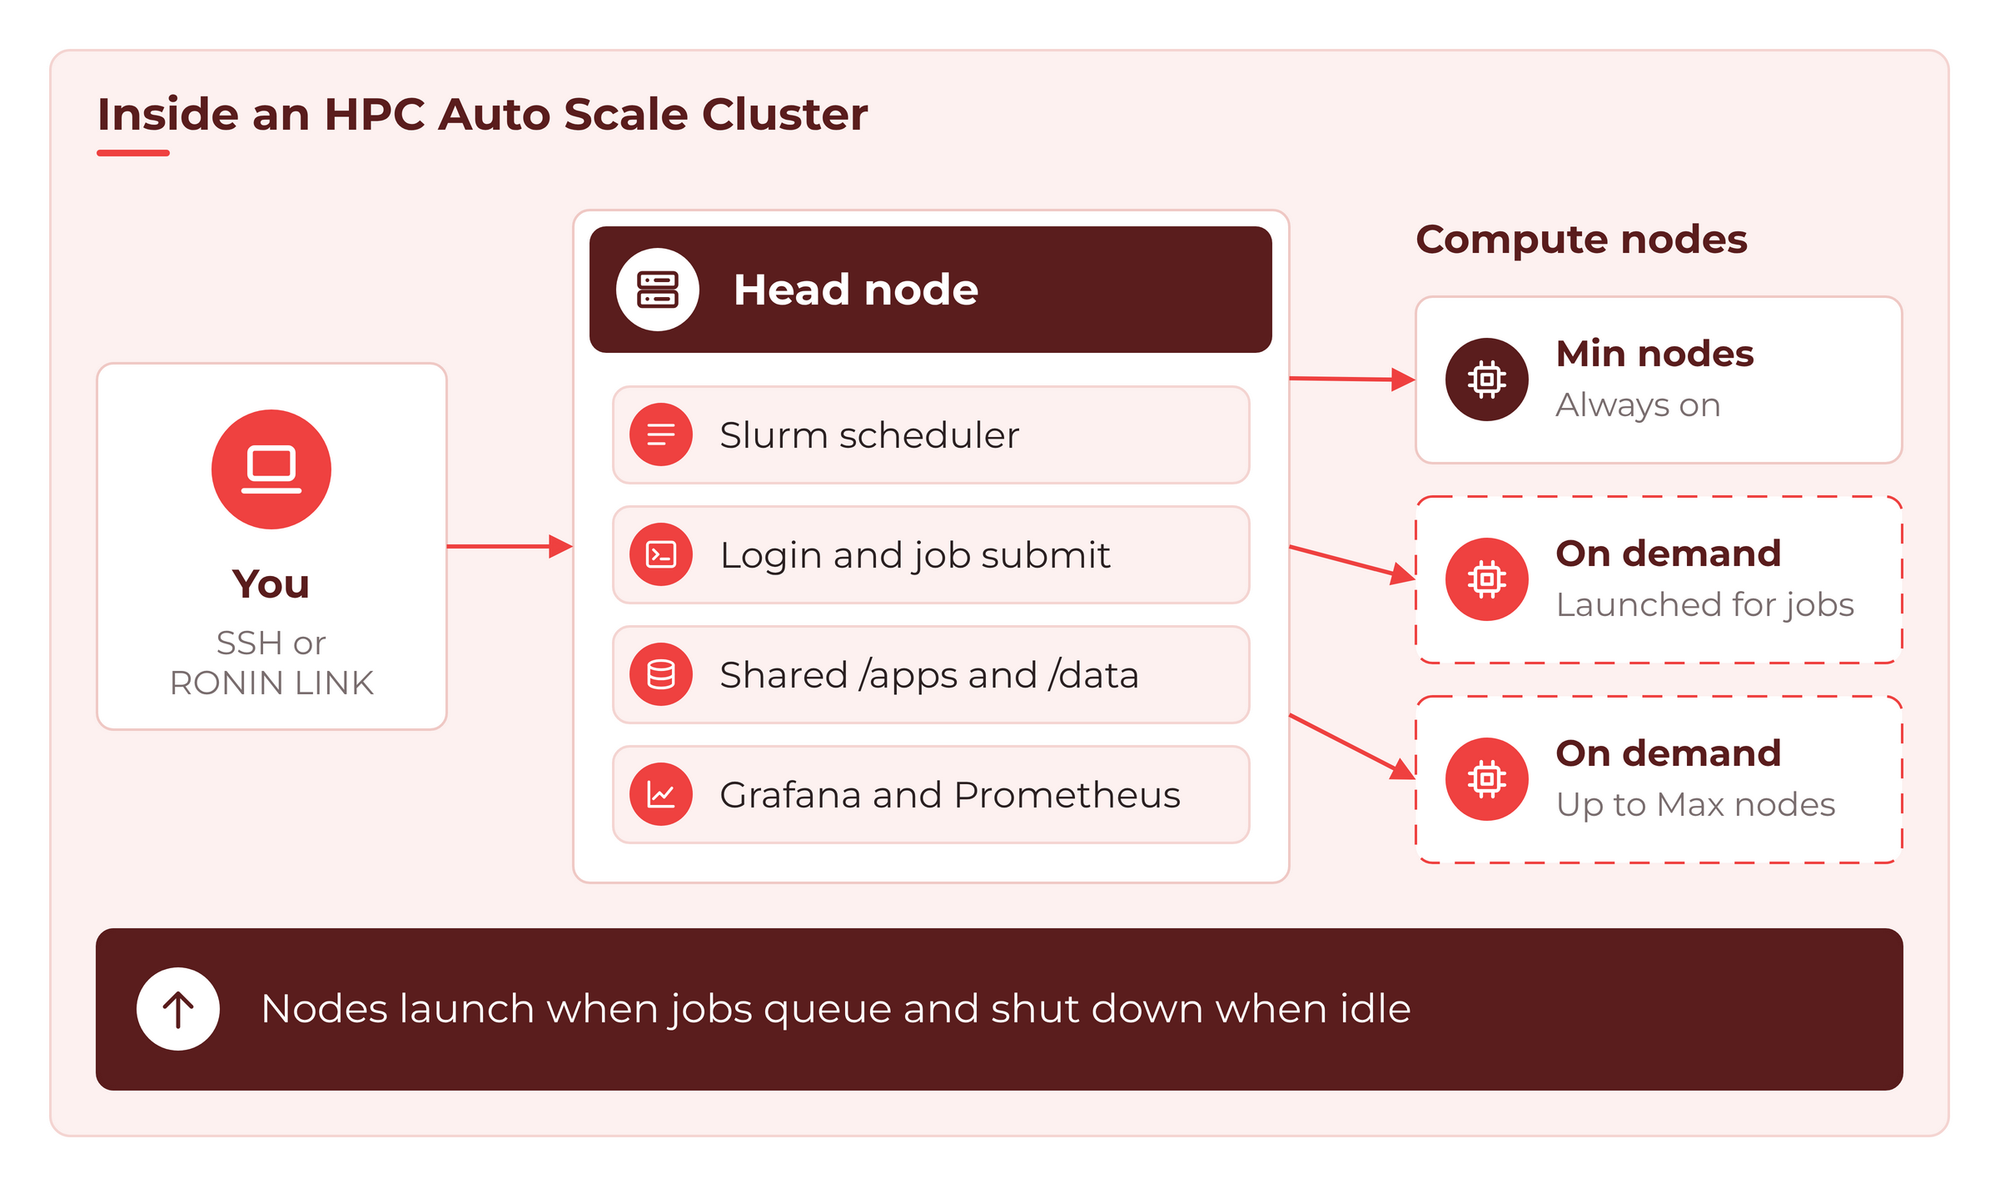
You connect to the head node with SSH or RONIN LINK, submit jobs with familiar Slurm commands like sbatch, squeue and sinfo, and let the cluster take care of the rest.
What's new
Native Slurm on Ubuntu 24.04
New clusters run Slurm natively on Ubuntu 24.04, a change from the cluster tooling RONIN used before. If you have used Slurm on a university system, you will feel right at home: submit with sbatch, check the queue with squeue, see your nodes with sinfo and look back at finished jobs with sacct, because job accounting is switched on for you. You can read more about that here.
Each job gets the CPUs and memory it asks for. Without --cpus-per-task or --mem, a job gets 1 CPU and an even share of the node's memory for each CPU. Several jobs share a node until its CPUs or memory are used up. With hyperthreading on (the default), one Slurm CPU is one vCPU, so a 4 vCPU node can run four 1-CPU jobs at once. With hyperthreading off, each node offers one CPU per physical core.
As the default ubuntu user, you can SSH from the head node to a running compute node, or between nodes, with ssh followed by the node name (for example ssh ip-10-0-1-10). Only the default ubuntu user is set up to work across nodes. Please note that Slurm doesn't know about an SSH session, so it may treat the node as idle and stop it after about five minutes - for interactive work on a compute node, start a session with salloc instead.
Autoscaling that follows your queue
Autoscaling of the cluster is driven by Slurm itself. Your Min nodes stay on, and any compute nodes beyond Min stay powered down until jobs are queued. When there are enough jobs in the Slurm queue requesting resources above your minimum nodes, new compute nodes will launch (up to your maximum number), run your work and shut down again once they are idle. Idle nodes power down after about five minutes of inactivity.
You stay in control with two numbers:
- Min nodes are always on, ready for your next job.
- Max nodes is the ceiling. The cluster will never launch more than this.
Set Min nodes to 0 and the cluster scales all the way down to just the head node when nobody is using it.
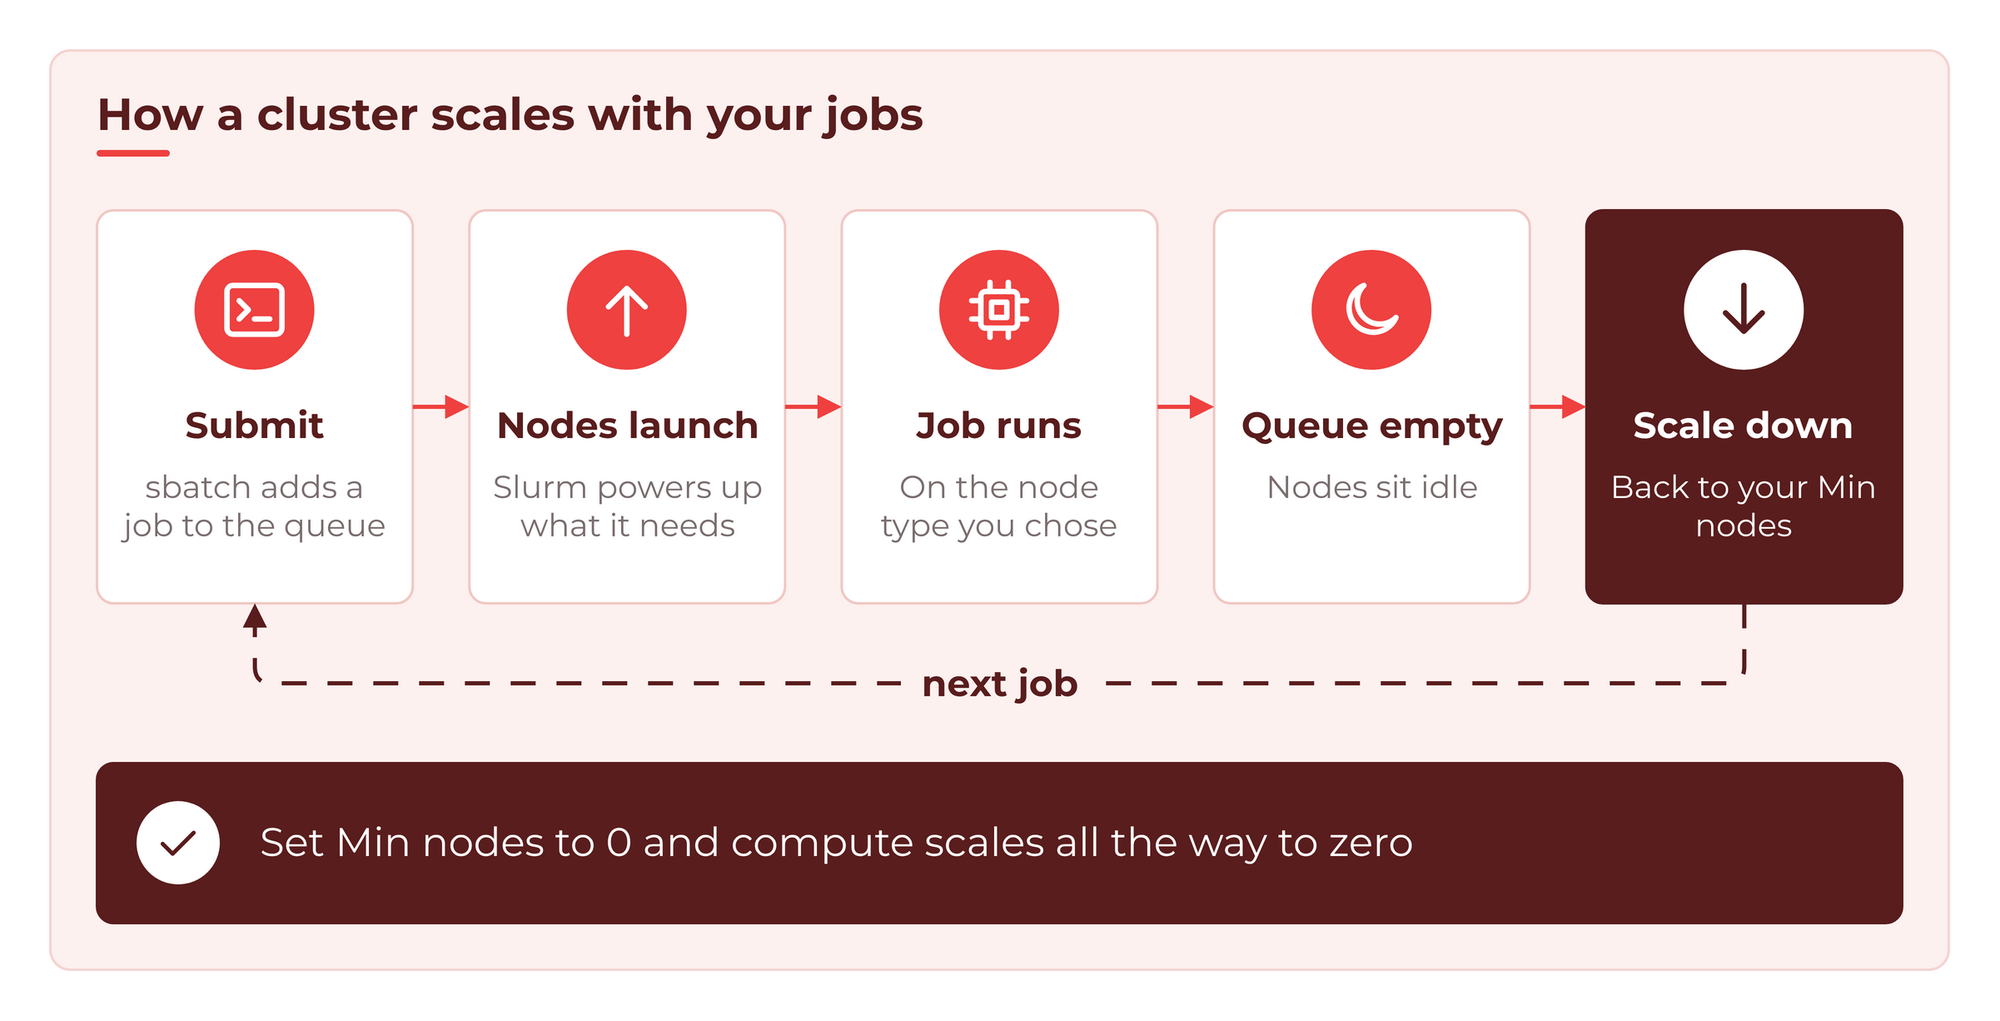
Here is what that looks like from the head node. Three jobs were queued on a cluster with Min nodes set to 0, and Slurm launched enough compute nodes to fit the queued jobs:
$ squeue
 JOBID PARTITION     NAME     USER ST       TIME  NODES NODELIST(REASON)
     1      main     burn   ubuntu  R       7:44      1 ip-10-0-1-10
     2      main     burn   ubuntu  R       7:44      1 ip-10-0-1-11
     3      main     burn   ubuntu  R       7:44      1 ip-10-0-1-12
Example output. Your node addresses will be different.
Built-in Grafana dashboards
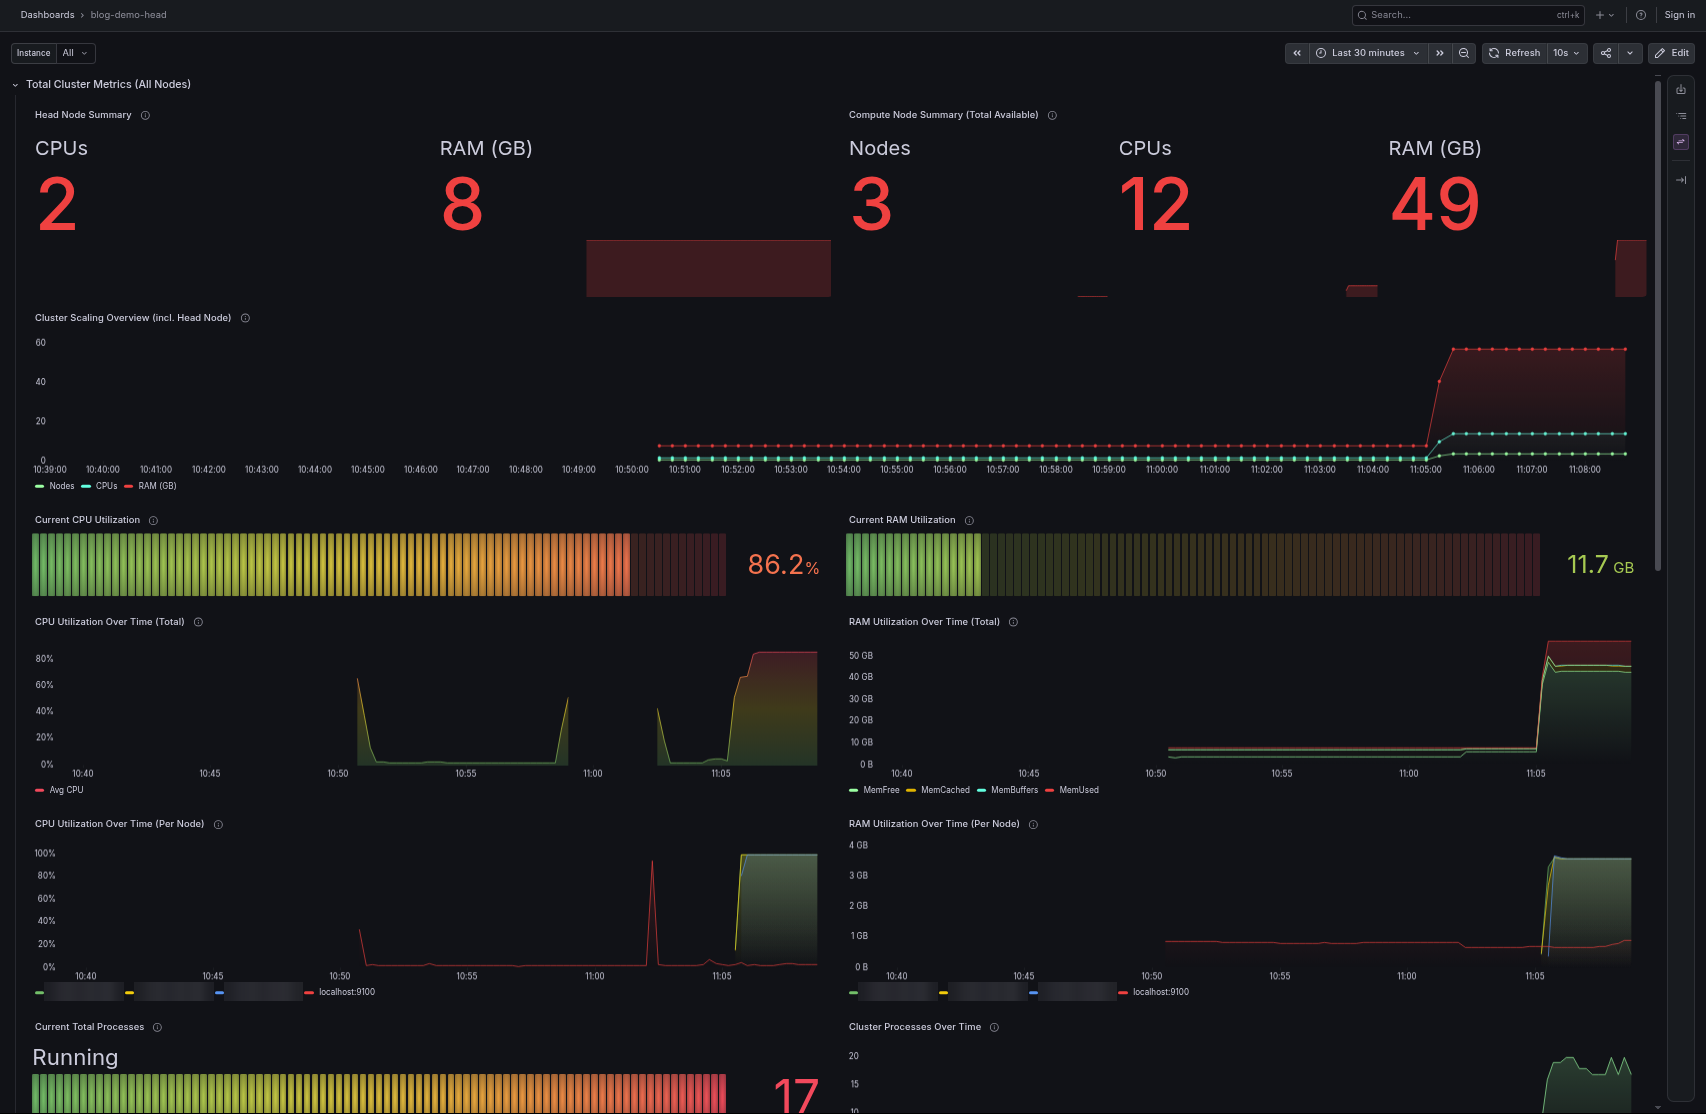
Every cluster now ships with Prometheus and Grafana on the head node, and a small metrics agent (node exporter) on every node. A ready-made dashboard shows the whole cluster at a glance: how many nodes are running, CPU and RAM use over time, storage on /apps and /data, disk activity, network traffic and more. You can then drill down into any single node.
This is the easiest way we know to answer the question every researcher should ask: is my job actually using the hardware I am paying for? Grafana replaces the Ganglia monitoring used by our earlier clusters.
Grafana and Prometheus are not exposed to the internet. You open them through RONIN LINK, and we walk through it step by step in How to Use Grafana Dashboards on Your HPC Auto Scale Cluster.
A new, guided create wizard
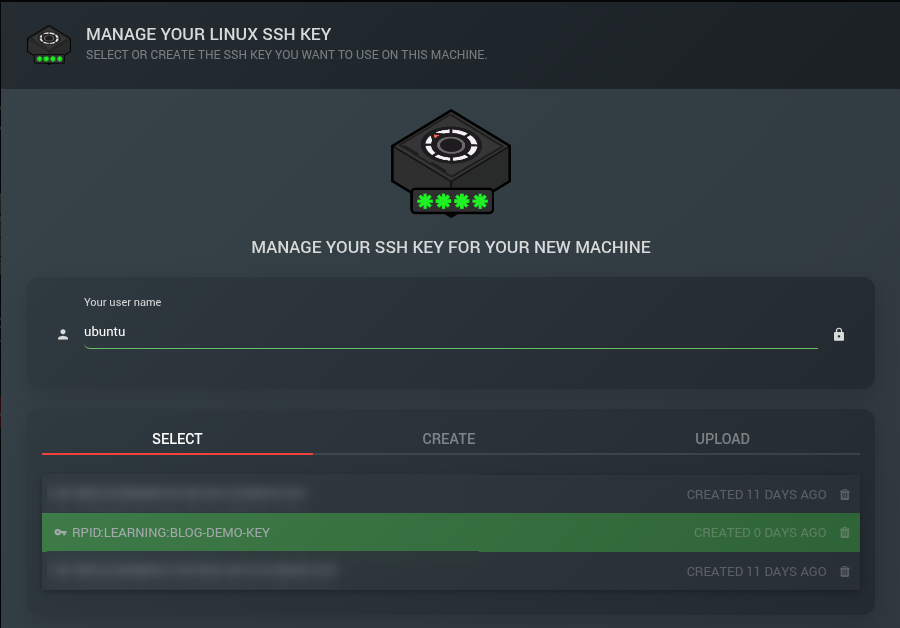
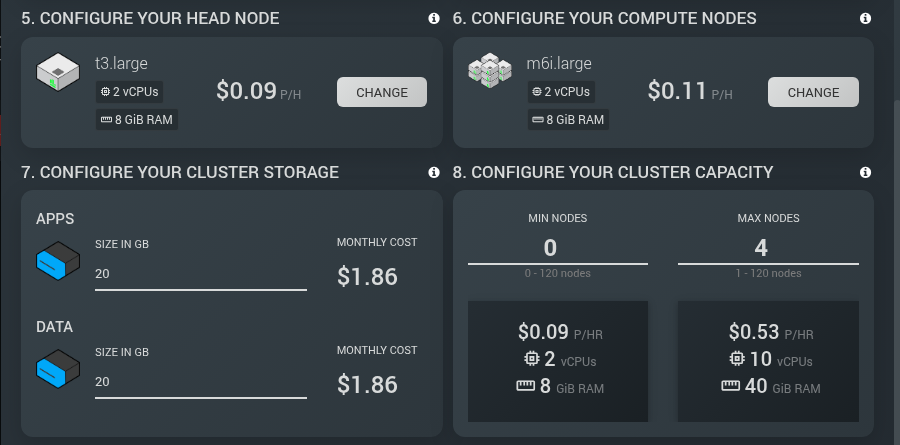
Creating a cluster now takes you through one clear section at a time: operating system, name, SSH key, head node, compute nodes, storage and capacity. Your cluster name becomes its address.
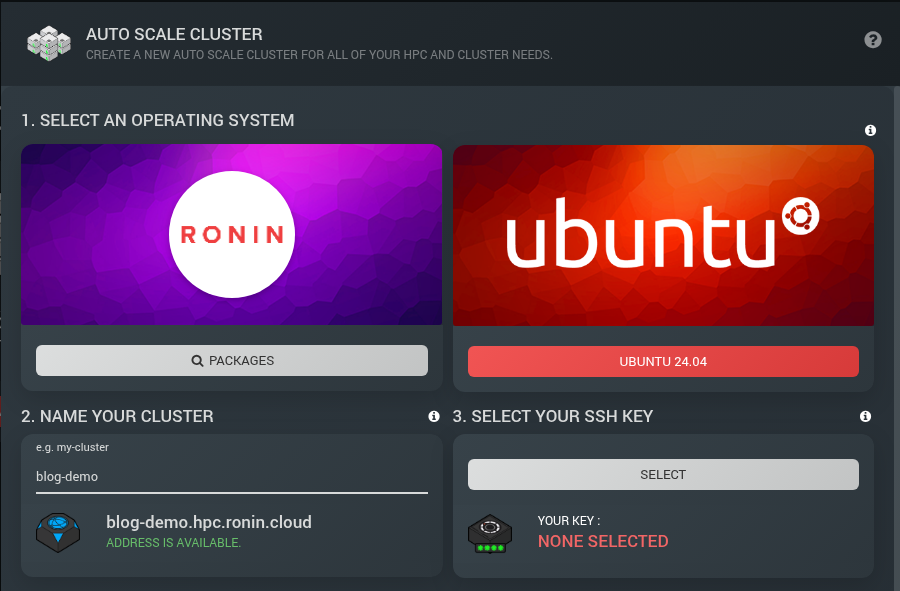
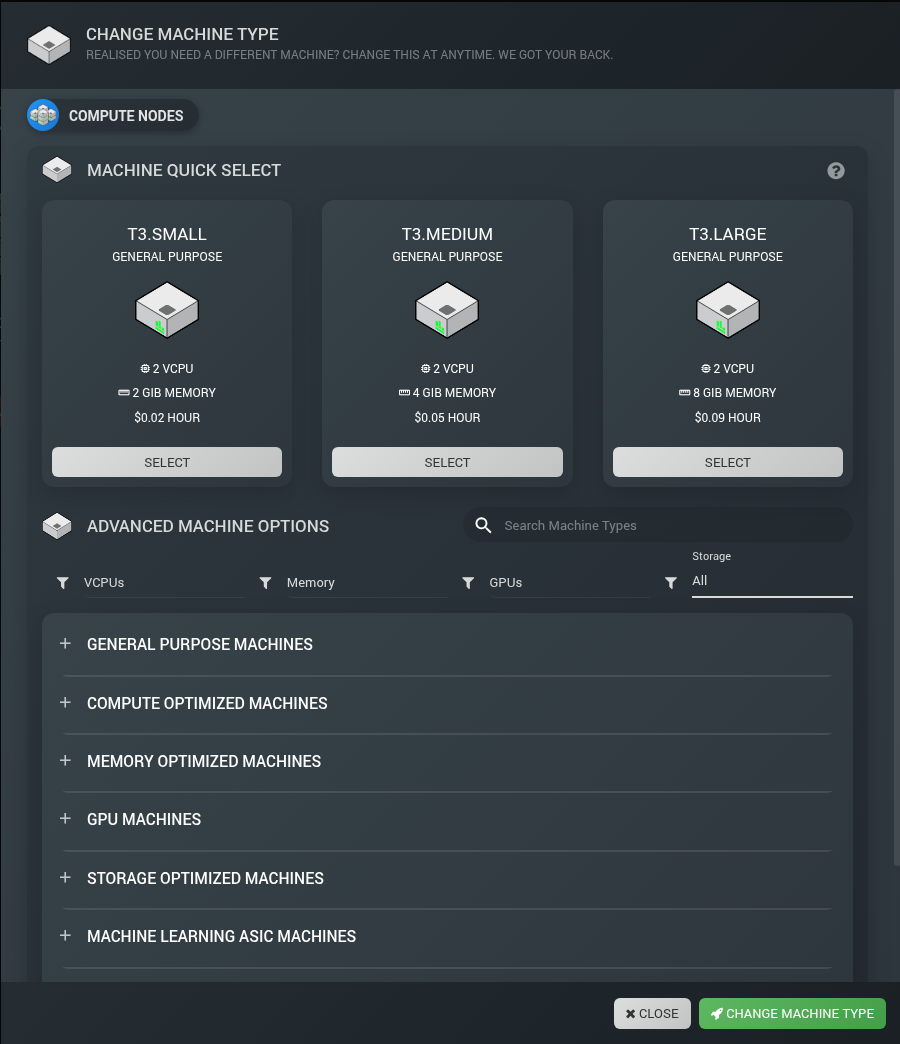
The compute node picker lets you quick select a common type, search, or filter by vCPUs, Memory, Storage and GPUs. Since our 15 October release, RONIN's instance list hides older non-nitro types and shows the newest instances first.
Before you launch, forecast tiles show the minimum and maximum hourly cost of your cluster, so you can see what idle and flat out will cost. As an illustration only, with a t3.large head node, m6i.large compute nodes, Min nodes set to 0 and Max nodes set to 4, the tiles showed $0.09 per hour minimum and $0.53 per hour maximum. These prices are illustrative only: they are in USD, vary by region and cover the head and compute nodes only; storage is priced separately in the wizard.
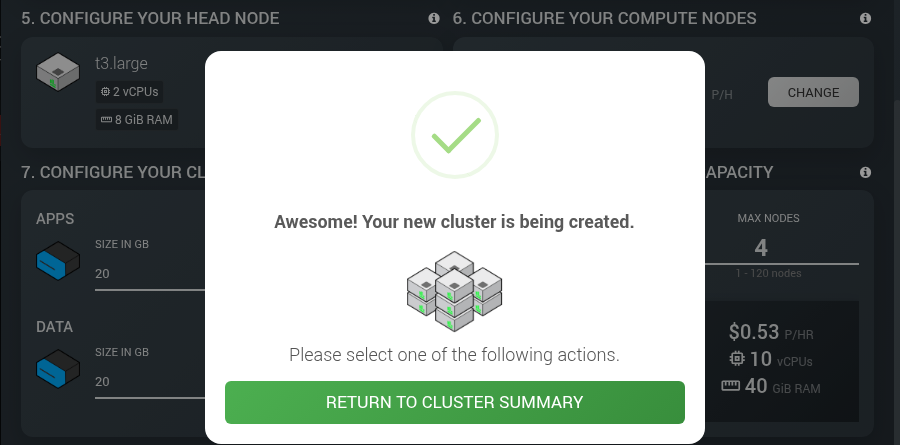
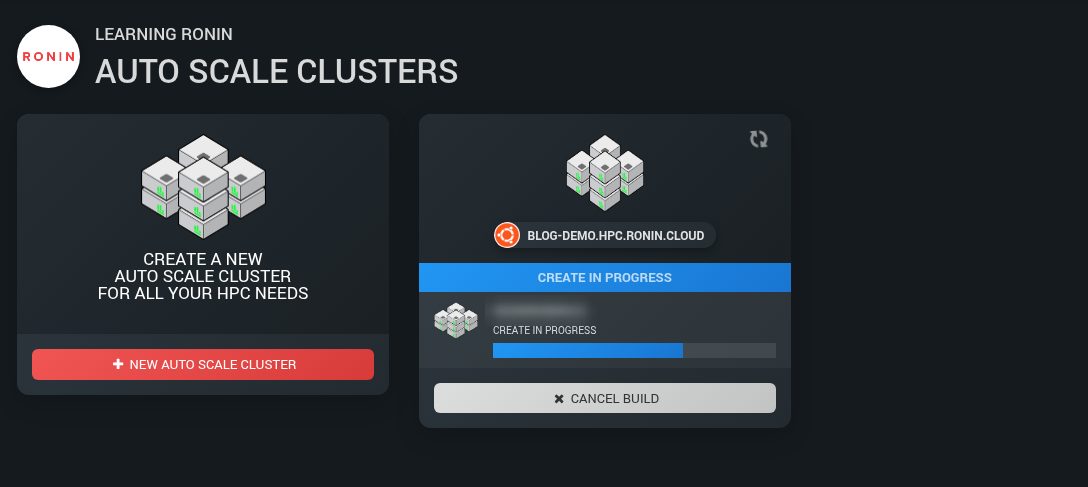
Click launch and you will see "Awesome! Your new cluster is being created." along with a progress card while it builds. Your new cluster will be ready in about 5 to 10 minutes.
If the cluster card does not refresh on its own, you can click the refresh button on the card (or reload the page) to see the latest status.
One place to manage your cluster
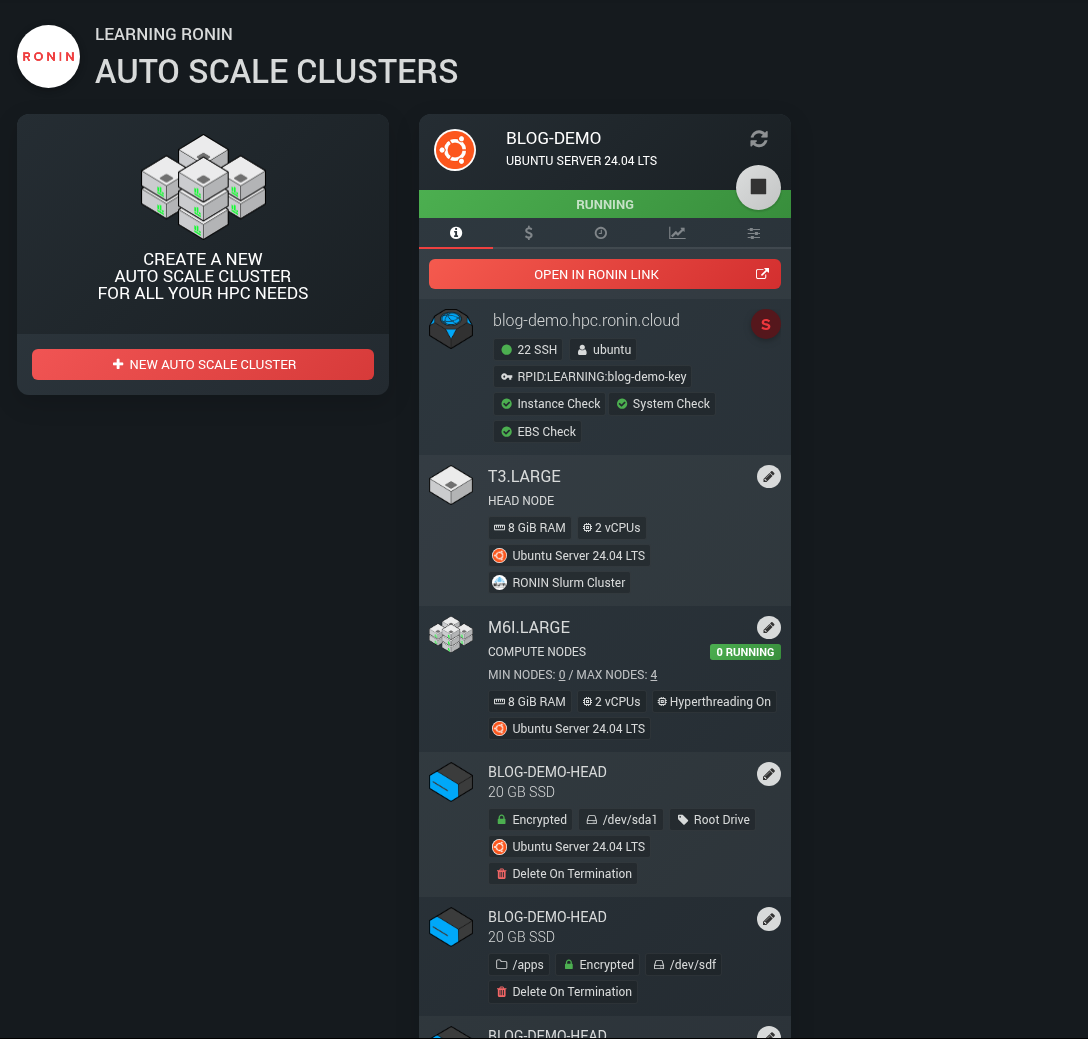
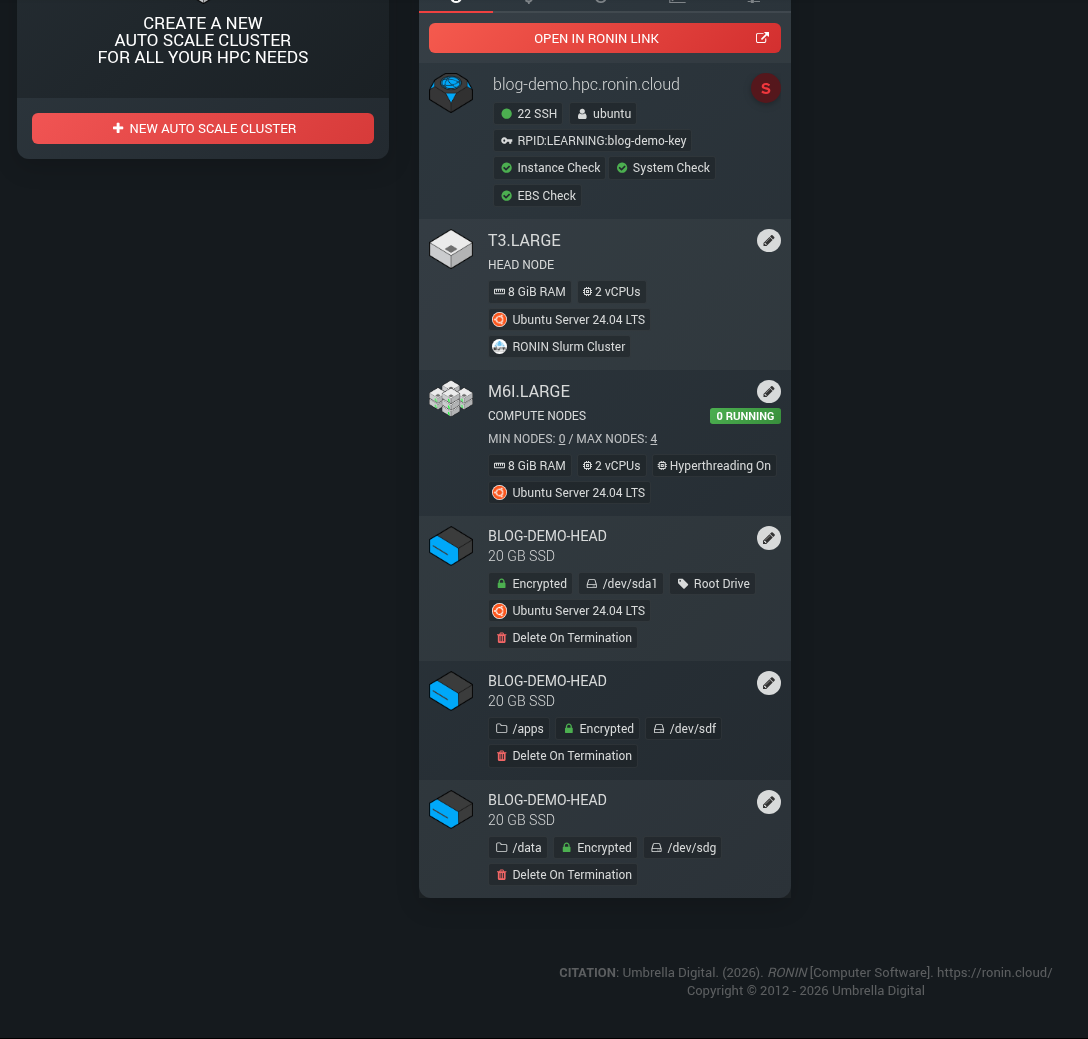
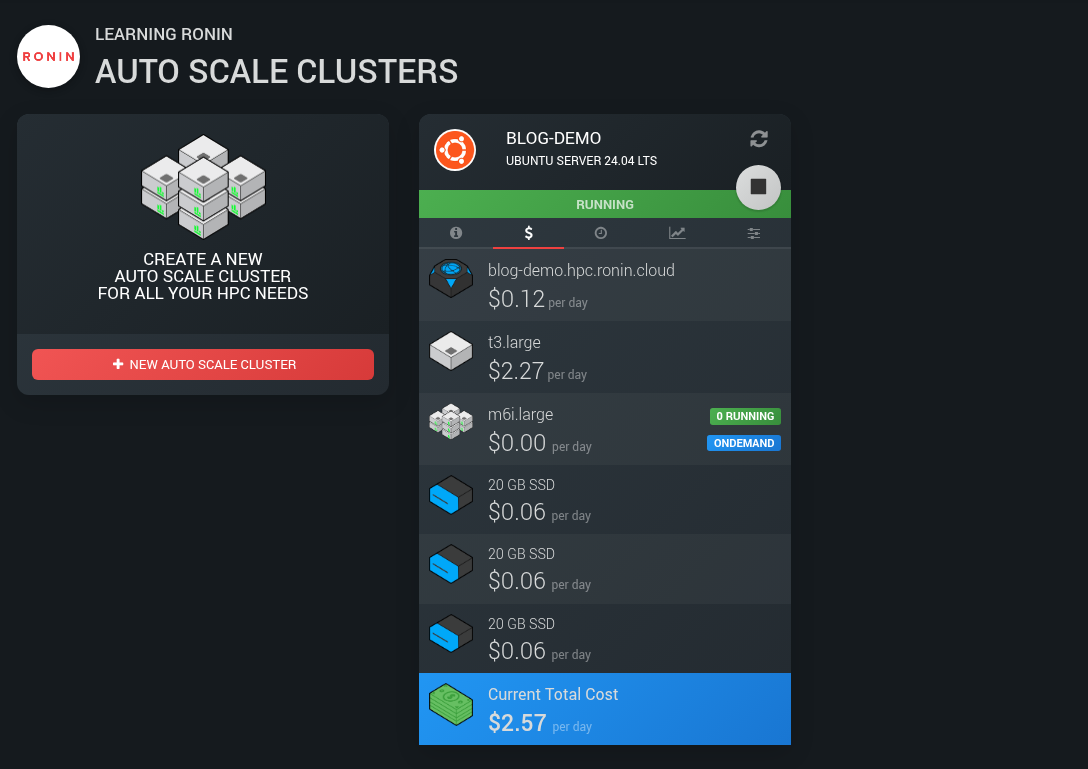
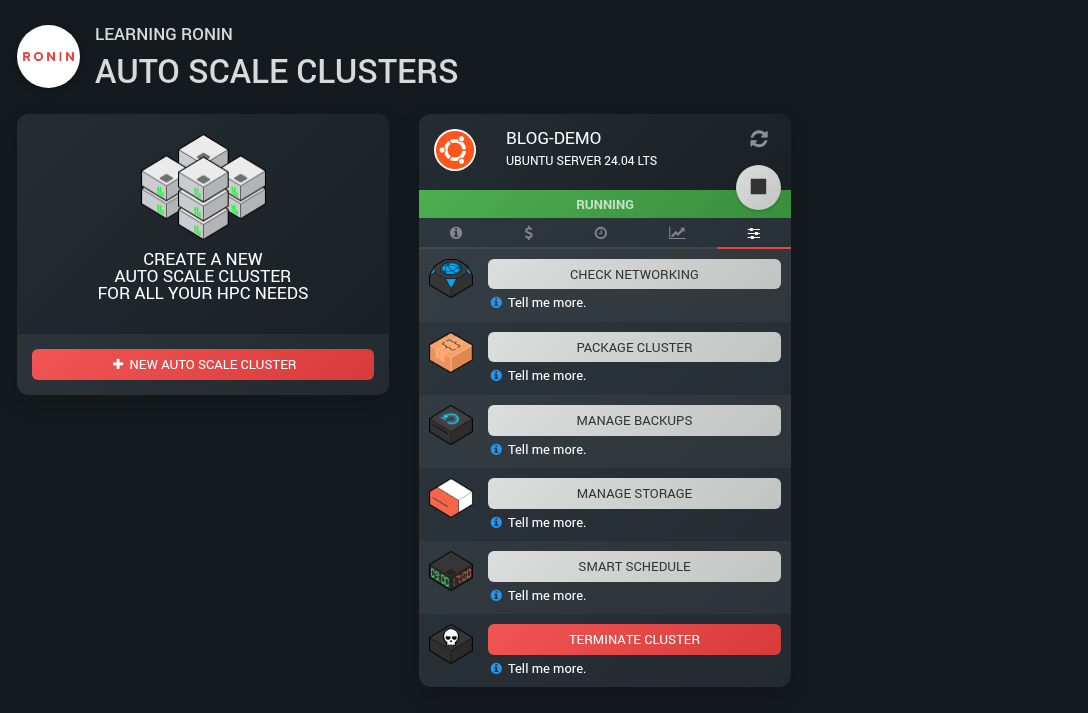
The Cluster Summary screen brings everything together under five tabs: Info, Cost, Schedule, Metrics and Actions. These tabs should look familiar since they are the same tabs used to manage single machines too.
- Info shows your cluster's address, an OPEN IN RONIN LINK button, the head and compute node types, how many nodes are running, your Min and Max nodes, and your storage drives.
- Cost shows daily cost for each part of the cluster.
- Schedule lets you use Smart Schedule to stop and start the cluster automatically.
- Metrics shows the latest metrics for the head node: average CPU and RAM utilisation and disk used for each mount, without leaving RONIN. It updates about every five minutes.
- Actions is where you check networking, package the cluster, manage backups and storage, or terminate it.
Change your compute nodes after launch
This is the one we are most excited about. You no longer need to rebuild or package a cluster just to change its node size. Stop the cluster, edit the compute node type or your Min and Max nodes, then start it again. The same works for the head node.
Stopping a cluster ends any running jobs and clears the queue, so finish or cancel your jobs first. Your /apps and /data drives are kept. Our step-by-step guide, Changing Compute Nodes in an HPC Auto Scale Cluster, covers it all.
Shared storage and software, ready to go
- /apps and /data are EBS drives attached to the head node and shared with every compute node for your software and data respectively. They start at 20 GB and can be increased from the Info tab, up to 16,000 GB. Your home folder (/home) is shared with every compute node too, so you can keep small job files there; however, we recommend keeping most of your files in /data so that you don't accidentally fill up your root drive. /tmp is local to each node, so it is best to redirect any temporary files to /data too. The head node's root disk is 50 GB by default.
- Spack comes preinstalled in /apps, so more than 9,000 software packages are one
spack installaway. - Stop and start whenever you like. Your cluster keeps the same name, so you can always connect using its address.
- Package Cluster is still there when you want a reusable copy of a cluster you have set up just right. Home folders carry over to clusters launched from a package, and their compute nodes get the same root disk size as the head node.
EFA for multi-node MPI jobs
If your jobs use MPI across several nodes, you can pick a compute node type that supports Elastic Fabric Adapter (EFA), a network interface for fast communication between nodes. AWS lists the supported types in its EFA documentation: https://docs.aws.amazon.com/AWSEC2/latest/UserGuide/efa.html#efa-instance-types
Build Open MPI with EFA support using Spack:
spack install openmpi fabrics=ofi ^libfabric fabrics=efa
To check EFA is available on a compute node, run:
fi_info -p efa
ls /dev/infiniband
By default, Open MPI may fall back to TCP without telling you. To make a job use EFA, add these options to mpirun:
mpirun --mca pml cm --mca mtl ofi --mca mtl_ofi_provider_include efa ...
How much EFA helps depends on how much your application communicates between nodes, so compare a short run with and without it before you commit.
Who can use it?
Any RONIN accounts that have clusters enabled will be able to use the new cluster tools. Clusters work just like machines: anyone in your RONIN project can create, edit, package and open them. If you cannot see the cluster option in your RONIN account, contact your RONIN administrator to enquire about getting them enabled.
Get started
- Launch a small cluster with Min nodes set to 0.
- Install something with Spack and submit a test job.
- Open Grafana and watch the cluster scale up and back down.
Then read our three hands-on guides:
- How to Use Grafana Dashboards on Your HPC Auto Scale Cluster
- Changing Compute Nodes in an HPC Auto Scale Cluster
- What Did My Job Actually Use? Slurm Accounting with sacct and seff on Your HPC Auto Scale Cluster
As always, if you have questions or feedback, we would love to hear from you.