
Monitoring your machine with btop and nvtop
Learn how RONIN LINK’s btop and nvtop monitors reveal CPU, memory and GPU usage, helping you check job health, spot bottlenecks and choose the right machine size to save time and cloud budget.


You've launched your analysis and everything has gone quiet. Is the job busy, stuck, or running short on memory? And is that GPU you're paying for actually doing anything?
A quick look at your machine answers all of these. It tells you whether your job is healthy, and whether the machine is the right size for it, which saves you time and cloud budget.
New in RONIN LINK, CPU MONITOR opens btop and the new GPU MONITOR opens nvtop. They're two friendly, full screen views of what your machine is doing right now, and RONIN LINK sets them up for you. You can read about everything else in the latest RONIN LINK in our main RONIN LINK post.
WHERE TO FIND THEM
Open your machine in RONIN LINK, click CONNECT TO MACHINE, and look for the Machine Monitoring group. It has four buttons: CPU MONITOR, GPU MONITOR, NETDATA and GRAFANA.
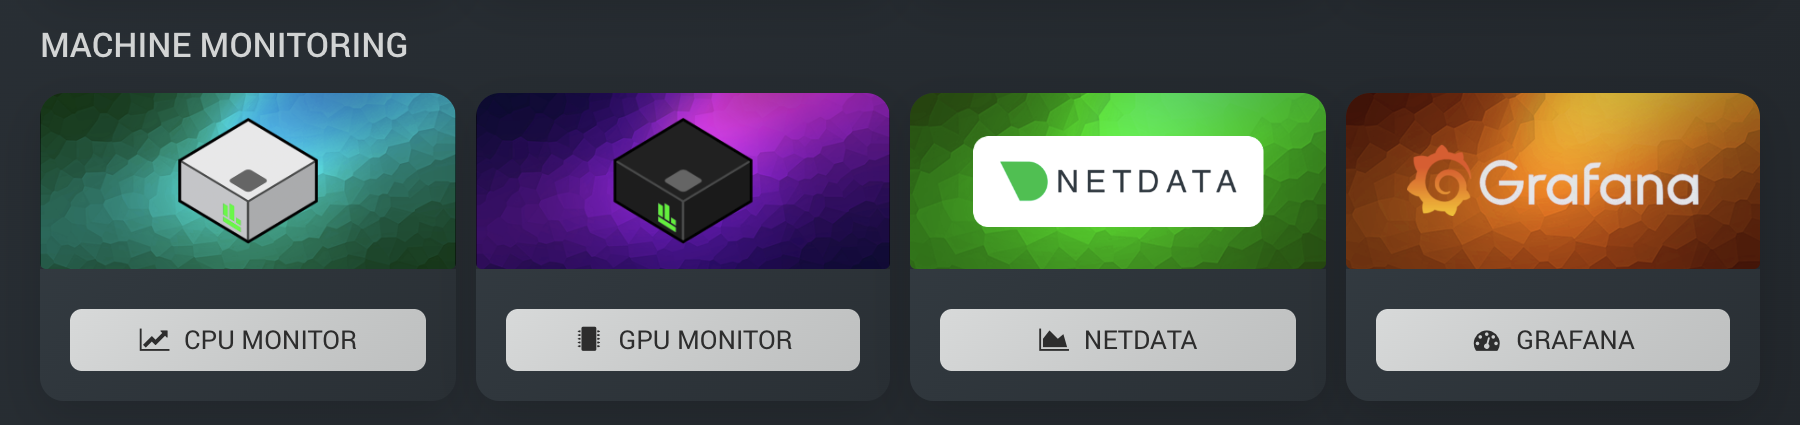
The monitors work on Linux machines. The GPU MONITOR is disabled on machines without an NVIDIA GPU.
THE FIRST CLICK: RONIN LINK SETS IT UP FOR YOU
If btop or nvtop isn't on your machine yet, RONIN LINK asks whether you'd like to install it, for example "This will install BTOP on MACHINE.RONIN.CLOUD. Would you like to continue?" Click INSTALL IT! to go ahead.
RONIN LINK uses your machine's own software packages where it can, and otherwise the official build from GitHub. When the install is complete, RONIN LINK will open the monitor in a new window for you.
Your machine needs internet access for this first install. If RONIN LINK can't reach the internet from where you're working, it will tell you the monitor isn't installed and ask you to check with your administrator. If you use RONIN Isolate and your machines don't have internet access, ask your admin to include btop and nvtop in the machine image. Once they're there, the buttons just work. And if btop isn't available and the machine has no internet access to install it, CPU MONITOR falls back to htop if it is already on the machine.
When you're finished, quit the monitor (press q) and the terminal window closes by itself.
CPU MONITOR: BTOP
btop is a colourful, live view of your machine's CPU, memory, disks, network and processes. It refreshes every 2 seconds by default, and your mouse works too: click any highlighted letter, or scroll through the process list.
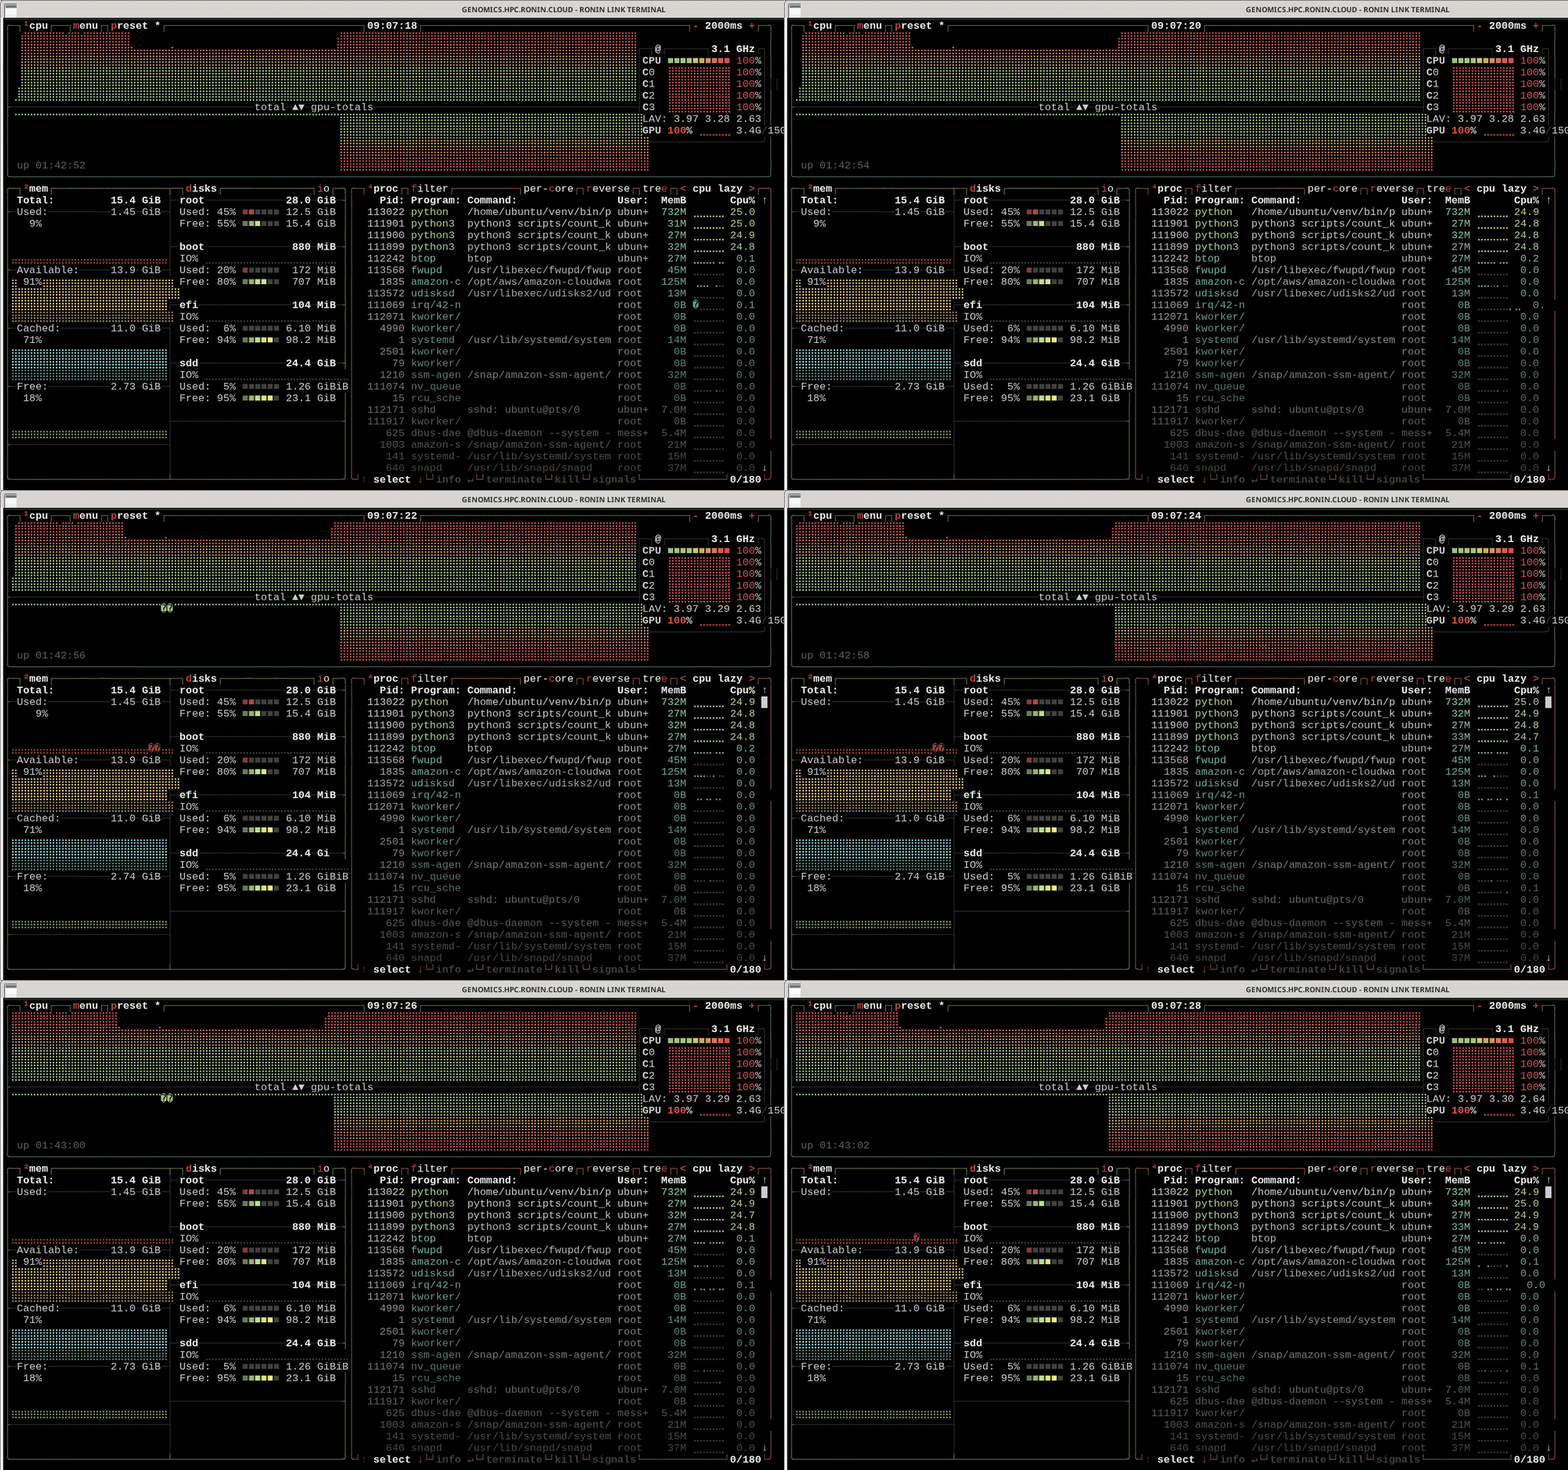
Here's what each box shows:
- CPU: a graph of overall CPU use, plus a bar for each core, the clock speed and the load average. If everything is near 100%, your job is using the whole machine.
- MEM: Used, Available, Cached and Free memory. Available is the one to watch. Cached is memory Linux is borrowing to speed up file access, and it hands it back when your job needs it.
- DISKS: how full each drive is, including the root drive and your data drives.
- NET: upload and download speeds, handy while you're copying data in or out. Press
3if it's hidden. - PROC: the processes using your CPU and memory. By default it's sorted so the busiest process stays near the top, which makes it easy to follow.
btop can also show a GPU row on some machines, but not all. That's why we cover nvtop below as the dedicated GPU monitor.
A handful of keys to get you started:
1,2,3and4show or hide the CPU, MEM, NET and PROC boxes.for/filters the process list. Try typing python.eswitches to a tree view, so you can see which processes started which.UpandDownselect a process, andEntershows its details.tasks the selected process to stop, andkforces it to stop.F2oroopens the options. btop saves your settings when you quit, so they're there next time.hor?lists every key, andqquits.
GPU MONITOR: NVTOP
nvtop (short for Neat Videocard TOP) is a live monitor for your GPUs. It shows each NVIDIA GPU's use, memory, temperature, power and clock speeds at the top, a chart of recent GPU and memory use in the middle, and the processes using the GPU at the bottom.
Before it opens, RONIN LINK checks that the NVIDIA driver is working. If it isn't, you'll see "Install the GPU driver first" with an INSTALL GPU DRIVER button, which runs GPU DRIVERS for you. Once the driver is installed, click GPU MONITOR again.
Some GPU machines need a restart before the driver works. If so, RONIN LINK offers to RESTART the machine for you. When it's back up, click GPU MONITOR again.
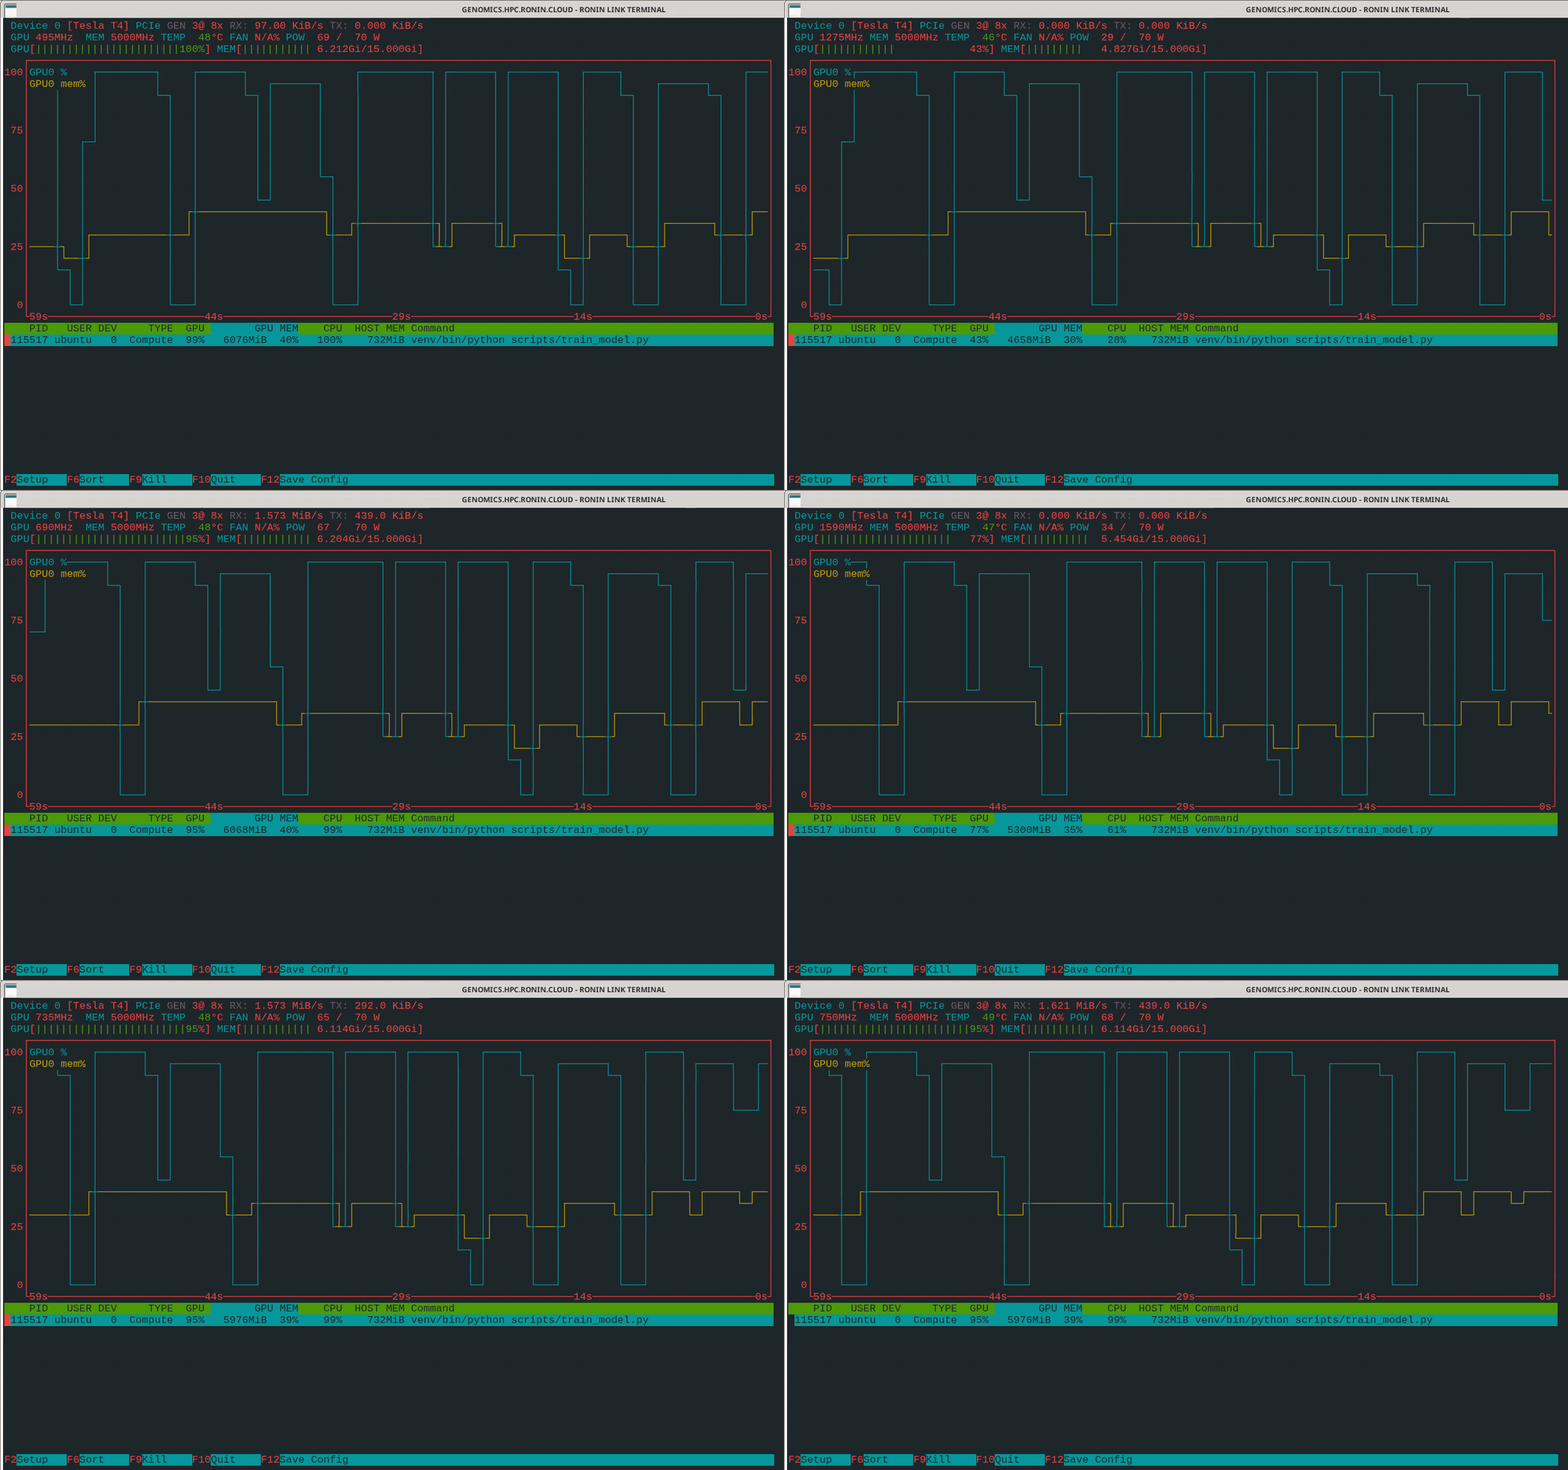
Here's how to read it:
- The GPU bar shows how hard the GPU is working.
- The MEM bar shows how much of the GPU's memory your job is holding. If it's close to full, a bigger batch won't fit.
- The process list shows which script is running on the GPU.
- A GPU line that keeps dropping to 0% can mean the GPU is waiting for data.
- Some fields, like FAN, can show N/A on cloud GPUs. That's normal.
Keys from nvtop's manual:
F2opens the setup, where you can choose what the chart shows, such as temperature or power draw.F6chooses what to sort the processes by.UpandDownselect a process, andF9sends it a signal to stop it.F12saves your layout for next time.F10,qorEscquits.
WHAT TO LOOK FOR (AND WHAT TO DO ABOUT IT)
Once you know what you're looking at, a quick check can tell you a lot:
- CPU MOSTLY IDLE DURING A LONG JOB: you may be on a bigger machine than you need, or your tool may need an option to use more threads. Check its documentation for a threads setting.
- ALL CORES BUSY AND THE JOB IS SLOW: a machine with more cores could help.
- AVAILABLE MEMORY CLOSE TO ZERO: your job may slow down or be stopped. Choose a machine with more memory.
- GPU BARELY USED: a smaller GPU machine may do the job just as well.
- GPU MEMORY FULL: a machine with a bigger GPU will give your job more room.
- ROOT DRIVE NEARLY FULL: free up some space before your job runs out.
For help choosing, see Selecting the Right Machine Type for the Right Job, and when you're ready to switch, see Changing Machines in RONIN.
A SNAPSHOT VERSUS THE WHOLE ANALYSIS: NETDATA
btop and nvtop are a great real-time snapshot of your machine, perfect for checking in on a job that's running right now.
For more comprehensive monitoring across a whole analysis on single machines, we recommend Netdata. In RONIN LINK, it's the NETDATA button right next to the monitors. RONIN LINK installs Netdata the first time you use it and opens it for you. To find out more, see Easy and Extensive Resource Monitoring with Netdata.
For RONIN clusters, the GRAFANA button opens the cluster's Grafana dashboards.
WRAPPING UP
Two clicks are all it takes to see whether your machine is earning its keep. Check in on your long jobs, use what you see to pick the right size next time, and turn to Netdata when you want the whole story. For all the other handy tools you can find in RONIN LINK, see our main RONIN LINK post.
Happy monitoring!