
Get an Email Alert When a RONIN Machine Fails a Status Check
Find out within minutes when any of your users' RONIN machines fails a status check, whether it has run out of memory, filled its drive or hit a problem with its host. This admin guide shows you how to set up an SNS email topic and one CloudWatch alarm that watches every machine in your region.

One of your users has kicked off a long analysis on a RONIN machine and gone to get on with something else. Partway through, the job asks for more memory than the machine has. The operating system runs out of RAM, freezes and stops responding. Unless they happen to be looking, they might only find out hours later when they try to connect through RONIN LINK, or when they realise the results they were waiting for never arrived.
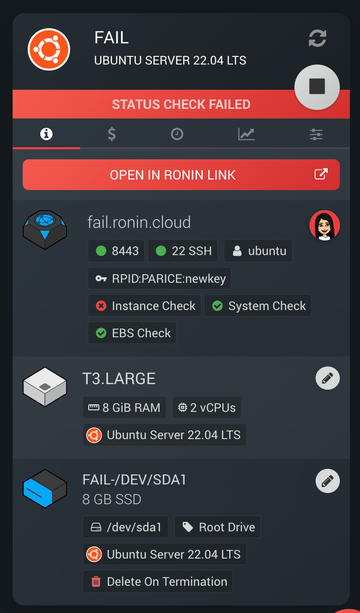
RONIN does show this. Every machine card in RONIN displays the machine's Instance Check, System Check and EBS Check, and when a check fails the card shows a red STATUS CHECK FAILED banner. Your users only see that when they log in to RONIN and look, though. As an admin, you can be alerted the moment any of their machines has a problem, so you can respond promptly and help them troubleshoot.
The good news is that AWS already runs status checks on every machine, every minute, at no charge, and they catch exactly this kind of failure. In this post we will show you how to turn those checks into an email alert in the AWS account your RONIN machines run in, using one Amazon CloudWatch alarm and one Amazon SNS email topic. It covers every user's machine in the region, including ones created later. RONIN users can't set this up themselves, because it is done in the AWS account, so this guide is for admins.
How it works
Amazon EC2 runs status checks on every running machine once a minute. The instance status check checks that the machine's operating system is still answering on the network. AWS lists exhausted memory, a corrupted file system, an incompatible kernel and bad network or startup configuration as typical reasons for it to fail, so this is the check that catches a machine that has run out of memory and frozen. The system status check watches the AWS hardware, power and network the machine runs on, and on Nitro based instance types the attached EBS status check checks that the machine can still reach its EBS volumes and complete reads and writes.
EC2 publishes the results to CloudWatch, including a combined metric called StatusCheckFailed. It is 0 when the machine has passed all of its status checks in the last minute and 1 when any of them fails. Watching this one metric covers a crashed or frozen operating system as well as problems with the host or storage underneath it. (On supported accelerated computing instance types, such as some GPU machines, a failed performance status check also sets it to 1.)
We will create a single CloudWatch alarm that uses a Metrics Insights query to watch that metric for every machine in the region, one by one. Each machine becomes a contributor to the alarm. When any machine fails a status check for 3 minutes in a row, the alarm sends a message to an SNS topic, and SNS emails it to you.
Before you start, sign in to the AWS Management Console for the account your RONIN machines run in, using an admin login that can create SNS topics and CloudWatch alarms, and select the same region as your machines. Everything below must be created in that region. If you have machines in more than one region, repeat these steps in each region.
Step 1: Set up the email topic in Amazon SNS
- Open the Amazon SNS console, choose Topics in the left menu, then choose Create topic.
- For Type, choose Standard. (Email subscriptions are only supported on standard topics.)
- For Name, enter
ronin-status-check-alerts. You cannot rename a topic later, so check the spelling. - Leave Encryption turned off, which is the default. An encrypted topic would need a customer managed KMS key with a key policy that lets CloudWatch use it, which is more setup than this alert needs.
- Choose Create topic.
Now subscribe your email address to the topic:
- On the topic page, choose Create subscription.
- For Protocol, choose Email. For Endpoint, enter your email address, or a shared support mailbox so your whole admin team is alerted.
- Choose Create subscription.
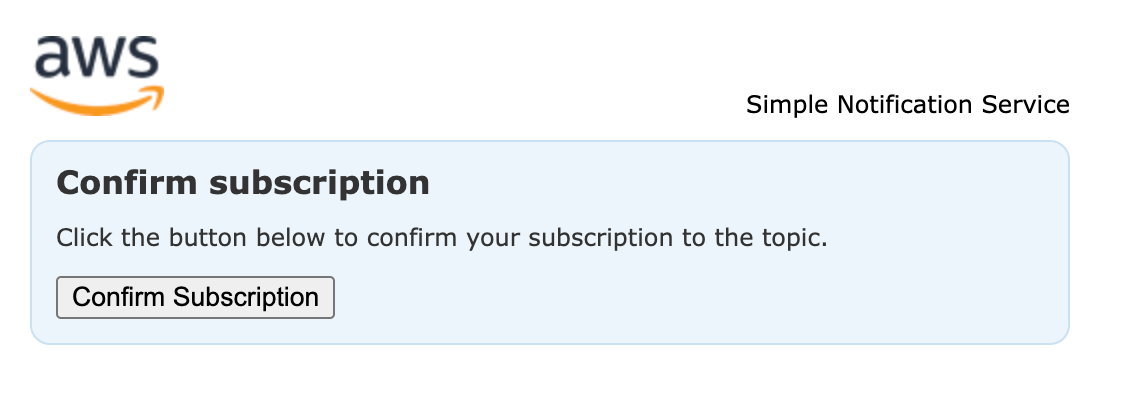
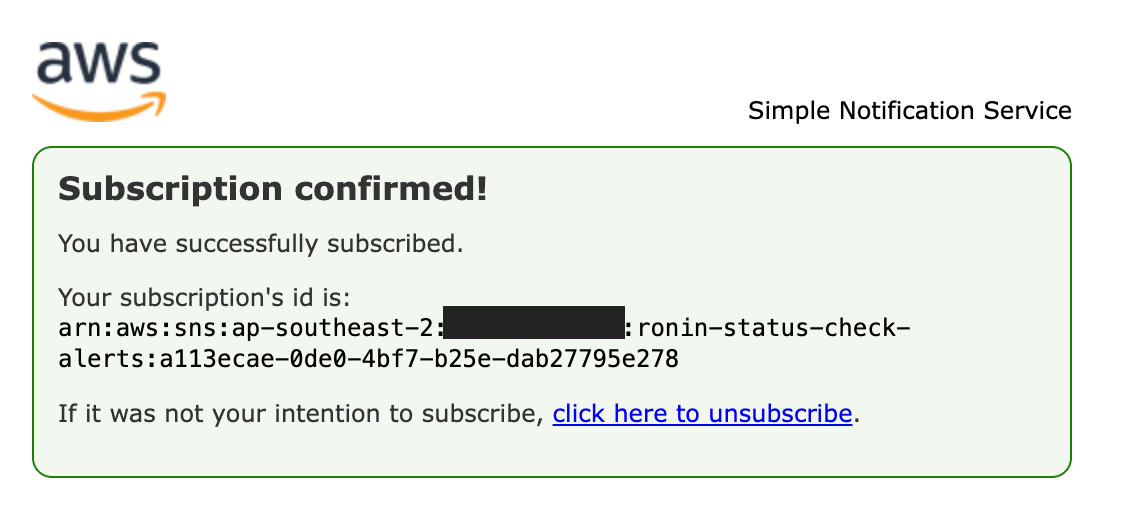
- Check your inbox for an email from AWS Notifications and choose Confirm subscription. Until you do, the subscription shows as Pending confirmation and nothing is delivered. AWS deletes unconfirmed subscriptions after 48 hours, so do this straight away.
Next, send yourself a test message so you know the email side works:
- On the topic page, choose Publish message.
- Enter any subject and message body, then choose Publish message at the bottom of the page.
- Check that the message arrives in your inbox.
- Finally, copy the topic ARN from the topic details. It looks like
arn:aws:sns:ap-southeast-2:123456789012:ronin-status-check-alerts. You will need it in Step 2.
Step 2: Create the alarm in AWS CloudShell
AWS CloudShell is a terminal that runs in your browser with the AWS CLI already installed and signed in as you. Open it from the CloudShell icon in the console navigation bar, and check the region shown above the command line is the same region as your machines.
Paste your topic ARN into the first line of the command below, replacing the example value, then paste the whole block into CloudShell and press Enter. CloudShell may ask you to confirm a multi line paste; choose Paste.
TOPIC_ARN="arn:aws:sns:REGION:ACCOUNT_ID:ronin-status-check-alerts"

aws cloudwatch put-metric-alarm \
  --alarm-name "RONIN Machine Failed Status Check" \
  --alarm-description "A machine has failed one or more of its EC2 status checks for 3 minutes, so it has stopped responding or has a problem with its host or storage (often from running out of memory, a full disk or a crash)." \
  --metrics '[{"Id":"m1","Expression":"SELECT MAX(StatusCheckFailed) FROM SCHEMA(\"AWS/EC2\", InstanceId) GROUP BY InstanceId ORDER BY MAX() DESC","Period":60,"ReturnData":true}]' \
  --comparison-operator GreaterThanOrEqualToThreshold \
  --threshold 1 \
  --evaluation-periods 3 \
  --datapoints-to-alarm 3 \
  --treat-missing-data notBreaching \
  --alarm-actions "$TOPIC_ARN"
If the command succeeds it prints nothing and returns you to the prompt. Here is what each part does:
- --metrics holds a Metrics Insights query that reads the combined
StatusCheckFailedmetric for every EC2 instance in the region and, throughGROUP BY InstanceId, keeps each machine as its own time series. New machines are picked up automatically, because the query is re run at every evaluation. - Period 60 with --evaluation-periods 3 and --datapoints-to-alarm 3 means a machine must fail a status check for 3 one minute periods in a row. A brief failure while a machine reboots will not trigger an email.
- --threshold 1 with GreaterThanOrEqualToThreshold means any failed check counts.
- --treat-missing-data notBreaching treats gaps in the data as healthy. A stopped machine stops reporting status checks, so it counts as OK rather than raising a false alarm. [CONFIRM: AWS documents that missing datapoints are treated as good with notBreaching, and that a contributor no longer returned by the query goes to OK; it does not explicitly say stopped instances stop publishing this metric.]
- --alarm-actions sends the alert to your
ronin-status-check-alertstopic.
With a multi machine alarm like this one, the email is sent per contributor. If a second machine fails while the first is still down, you get a second email for that machine.
Optional: alert for one specific machine
If you only want to watch one particular machine, such as a critical server, rather than every machine in the region, you have two options. Both send to the same ronin-status-check-alerts topic. You will need the machine's instance ID, which looks like i-0abcdef1234567890. In the EC2 console, choose Instances and search for the machine name to find it.
Option 1: the EC2 console. In the EC2 console, choose Instances and select your machine. On the Status and alarms tab, choose Actions, then Create status check alarm. Turn on alarm notifications and choose the ronin-status-check-alerts topic.
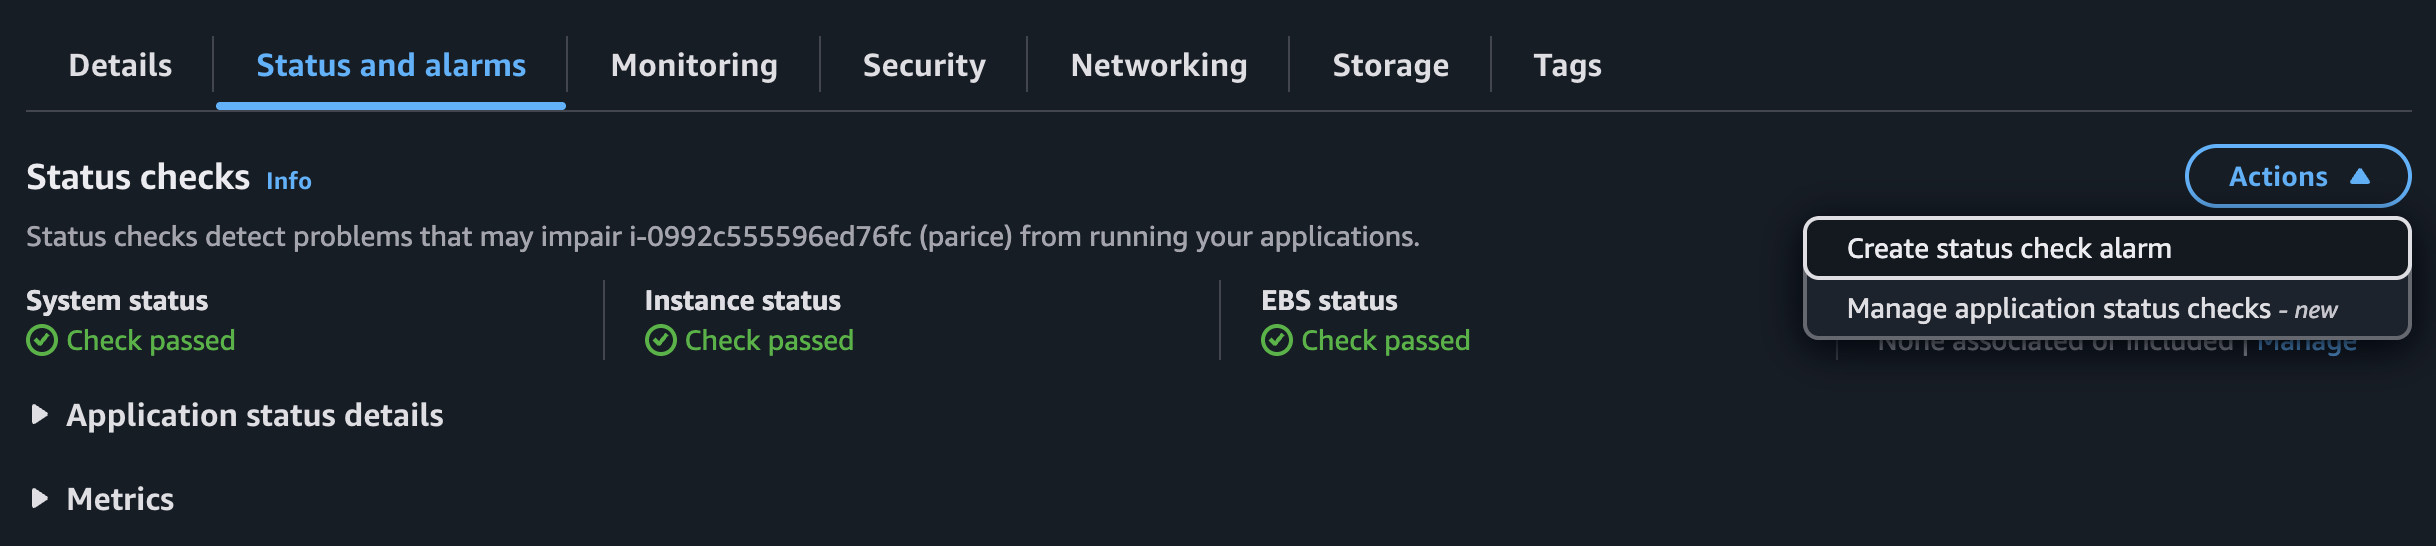
On the next screen you will need to set the ronin-status-check-alerts SNS topic as the Alarm notification.
Option 2: the command. In CloudShell, set your topic ARN on the first line, replace i-xxxxxxxxxxxxxxxxx with your instance ID and my-machine with your machine name, then run:
TOPIC_ARN="arn:aws:sns:REGION:ACCOUNT_ID:ronin-status-check-alerts"

aws cloudwatch put-metric-alarm \
  --alarm-name "RONIN Machine Failed Status Check (my-machine)" \
  --alarm-description "The machine my-machine has failed one or more of its EC2 status checks for 3 minutes, so it has stopped responding or has a problem with its host or storage (often from running out of memory, a full disk or a crash)." \
  --namespace AWS/EC2 \
  --metric-name StatusCheckFailed \
  --dimensions Name=InstanceId,Value=i-xxxxxxxxxxxxxxxxx \
  --statistic Maximum \
  --period 60 \
  --evaluation-periods 3 \
  --datapoints-to-alarm 3 \
  --threshold 1 \
  --comparison-operator GreaterThanOrEqualToThreshold \
  --treat-missing-data notBreaching \
  --alarm-actions "$TOPIC_ARN"
What the alert email looks like
When a machine stops responding, you will receive an email from AWS Notifications that looks like this (trimmed to the useful parts):
You are receiving this email because your Amazon CloudWatch Alarm "RONIN Machine Failed Status Check" contributor "2cd2226106a366a2" in the Asia Pacific (Sydney) region has entered the ALARM state, because "Threshold Crossed: 3 out of the last 3 datapoints were greater than or equal to the threshold (1.0). The most recent datapoint which crossed the threshold: [1.0 (30/10/26 06:28:00)] (minimum 3 datapoints for OK -> ALARM transition)." at "Friday 30 October, 2026 06:29:34 UTC".

View this alarm in the AWS Management Console:
https://console.aws.amazon.com/cloudwatch/... (link to your alarm)

Alarm Details:
- Name:          RONIN Machine Failed Status Check
- Description:   A machine has failed one or more of its EC2 status checks for 3 minutes, so it has stopped responding or has a problem with its host or storage (often from running out of memory, a full disk or a crash).
- AWS Account:   123456789012
- Alarm Arn:     arn:aws:cloudwatch:ap-southeast-2:123456789012:alarm:RONIN Machine Failed Status Check

Contributor Details:
- Id:            2cd2226106a366a2
- State Change:  OK -> ALARM
- Timestamp:     Friday 30 October, 2026 06:29:34 UTC

Contributor Attributes:
- InstanceId:    i-05bb8ce0bbceea666

State Change Actions:
- ALARM: [arn:aws:sns:ap-southeast-2:123456789012:ronin-status-check-alerts]
The fields to look at are:
- has entered the ALARM state tells you a machine has failed one or more of its status checks for 3 minutes in a row. The reason line shows the 3 failed datapoints.
- Contributor Attributes: InstanceId tells you exactly which machine it is. Search for this instance ID in the EC2 console to see the machine's name, then find that machine in RONIN so you know whose it is.
- View this alarm in the AWS Management Console is a direct link to the alarm, where you can see its history and every machine it is watching.
- Timestamps are in UTC, so convert them to your local time (06:29 UTC is 5:29 PM in Sydney during daylight saving).
The email does not say which check failed or why. To find out, select the instance in the EC2 console and open its Status and alarms tab, or look at the machine card in RONIN, which shows its Instance Check, System Check and EBS Check.
From there you can help the user work out what went wrong. In the EC2 console, select the instance and choose Actions, Monitor and troubleshoot, then Get system log to see the machine's console output, where out of memory errors and kernel panics usually show up. Get instance screenshot in the same menu shows what is on the machine's screen. If the machine sends its logs to CloudWatch Logs, check those too. The most common causes are running out of RAM, a full root drive or a crash.
If the instance check failed, the machine usually needs a restart from RONIN before the user can connect again. If it ran out of RAM, and especially if it keeps happening, the machine needs more memory, so help the user resize it to a larger instance type. If the root drive is full, the user will need to free up space or increase the drive size. If the system or EBS check failed, the problem is with the AWS host or storage rather than the user's workload, and stopping and starting the machine usually moves it to a healthy host.
Viewing the alarm in the AWS Console
You can check on the alarm at any time:
- Open the CloudWatch console in the same region as your machines.
- In the left menu, choose Alarms.
- Choose the alarm named RONIN Machine Failed Status Check. (Its action sends to the
ronin-status-check-alertsSNS topic, but the alarm list shows the alarm name.)
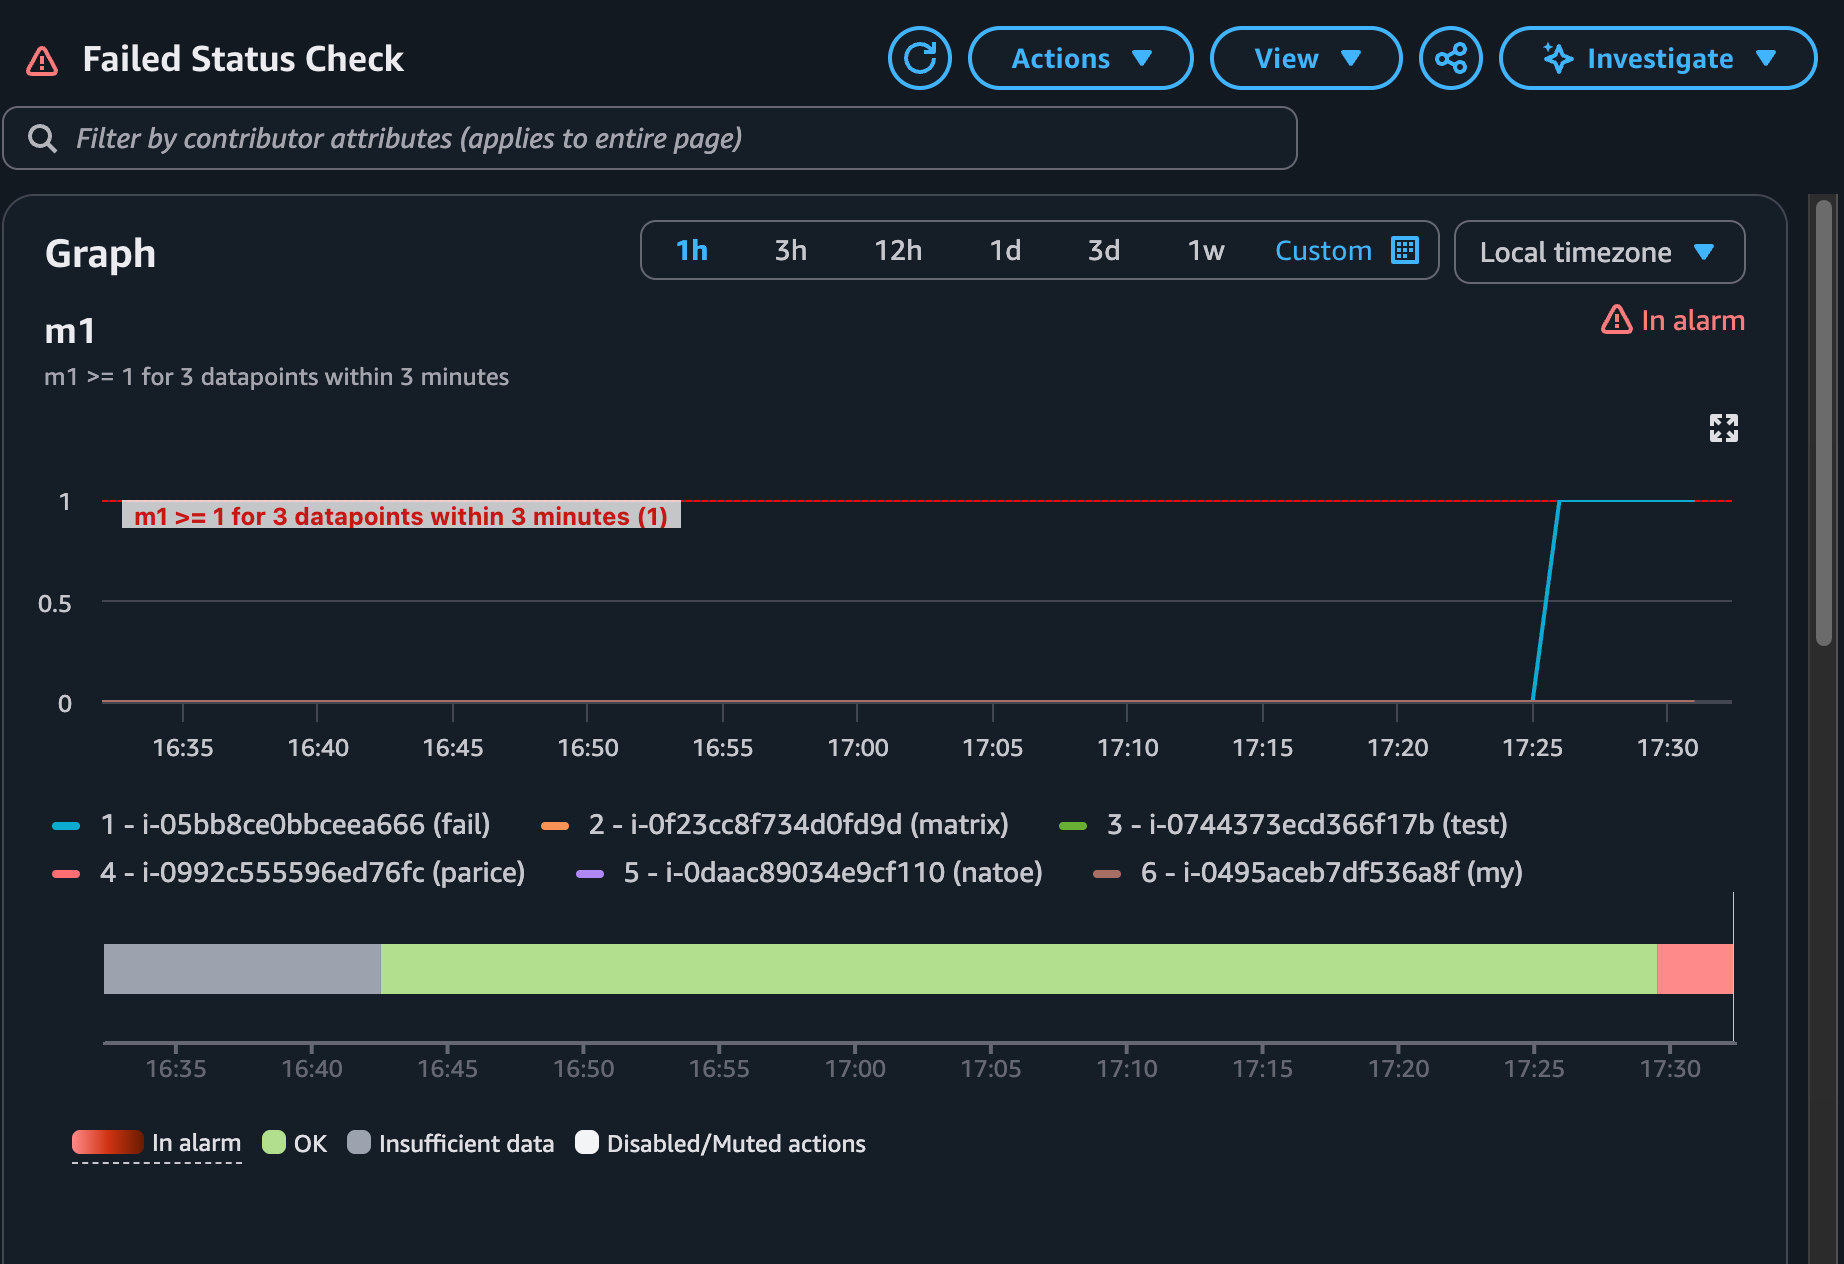
The alarm shows OK when no machines have failed a status check and In alarm when at least one has. Because this is a multi instance Metrics Insights alarm, each machine is listed as a contributor with its own state, so the alarm page shows you which instance is in alarm.
Wrapping up
That is all it takes: one SNS topic, one confirmed email subscription and one CloudWatch alarm, and every machine in the region is covered, including new ones. Instead of a user discovering a frozen or failed machine hours later, you will know within a few minutes and can help them restart it, give it more memory, free up disk space or move it to a healthy host, before they lose more time.
CloudWatch alarms and SNS notifications are billed at normal AWS rates in your own account. See the Amazon CloudWatch pricing and Amazon SNS pricing pages for details.