Ganglia on Auto Scale Clusters
All RONIN Clusters get a free open source tool called Ganglia to help monitor your hardware. This article shows you how

All RONIN Clusters get a free open source tool called Ganglia to help you monitor your hardware and ensure you're getting every bang for your buck. This article shows you the basics of Ganglia
You will want to create a cluster and also download RONIN LINK before starting this article.
Running Ganglia
First open RONIN LINK and connect to your cluster
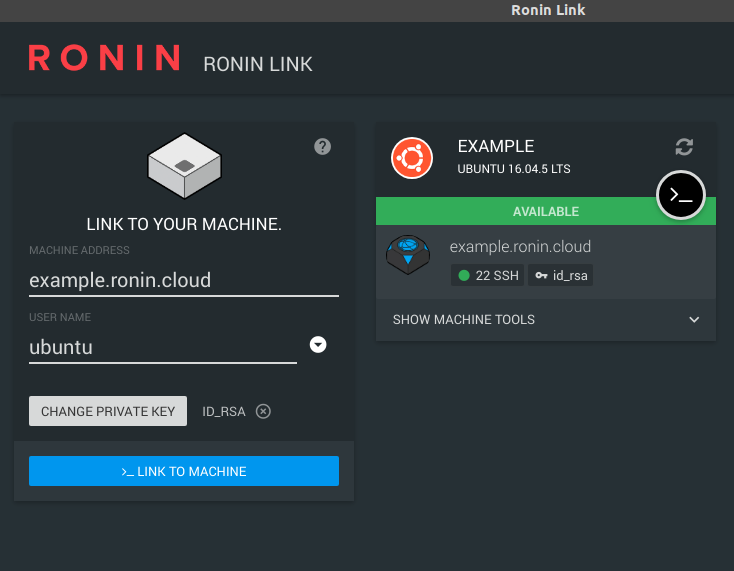
Click Show Machine Tools
Click Link to Desktop
On the right side of Ganglia click LINK
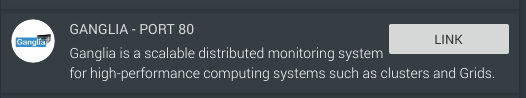
RONIN LINK will now open you a secure view of Ganglia running in your web browser!
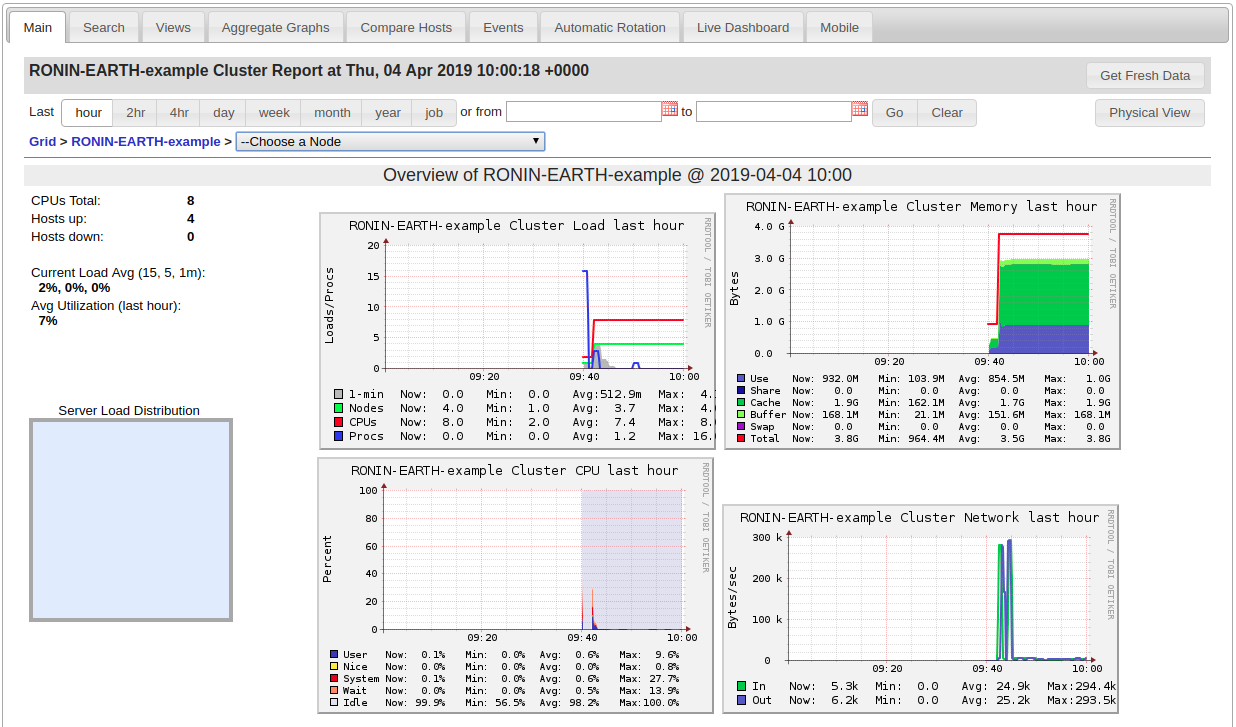
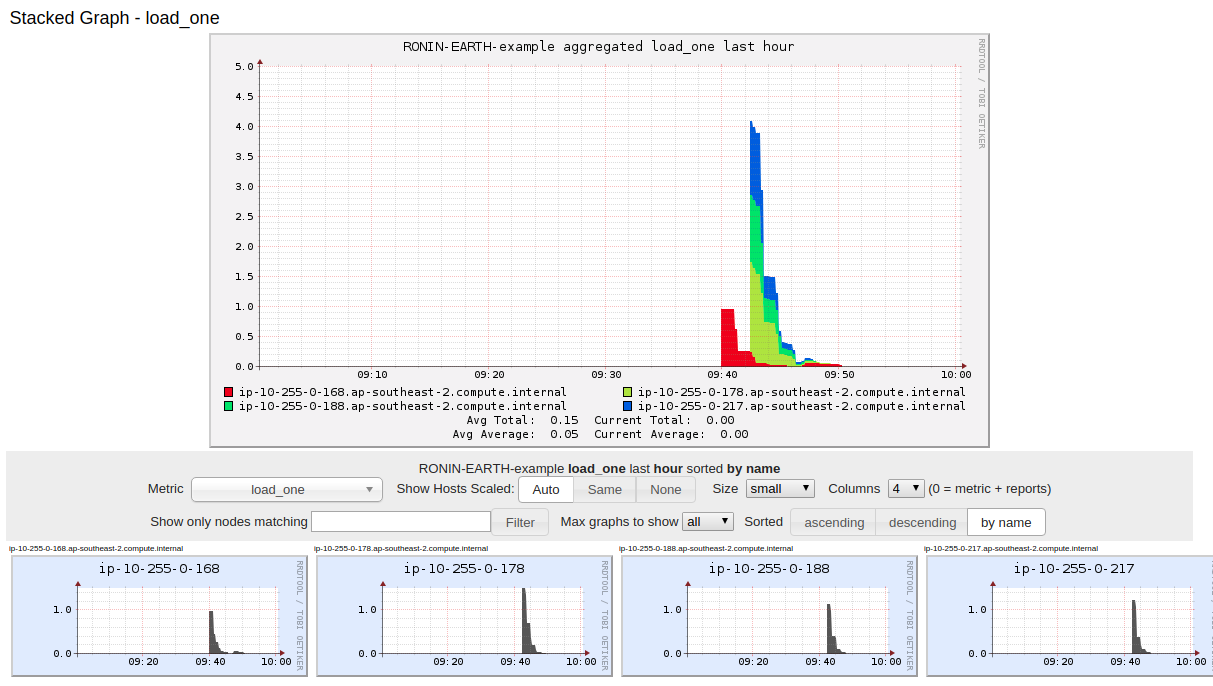
The main page shows the grid view, which is an overview of your monitored nodes.
Below this shows you how well your cluster is performing, and a quick window into each nodes performance as well.
The main tab allows you to view the data from set and custom time increments. You can also manually refresh the data by clicking the Get Fresh Data button in the top right.

Below the time range selection, you can choose a specific node from the dropdown menu (if you have any)
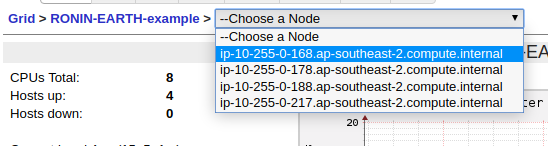
Select any from the list to see information specific to that individual node.
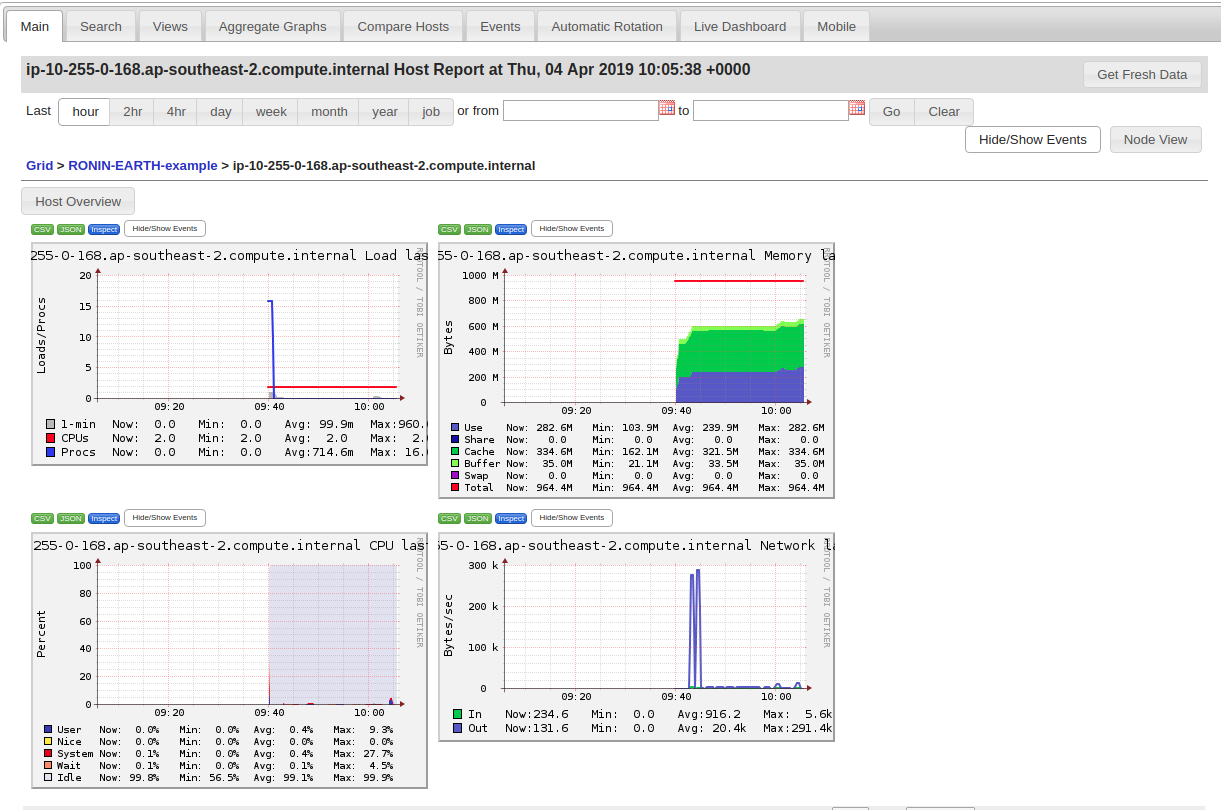
Below you can see specifics of individual nodes and how it performed over time
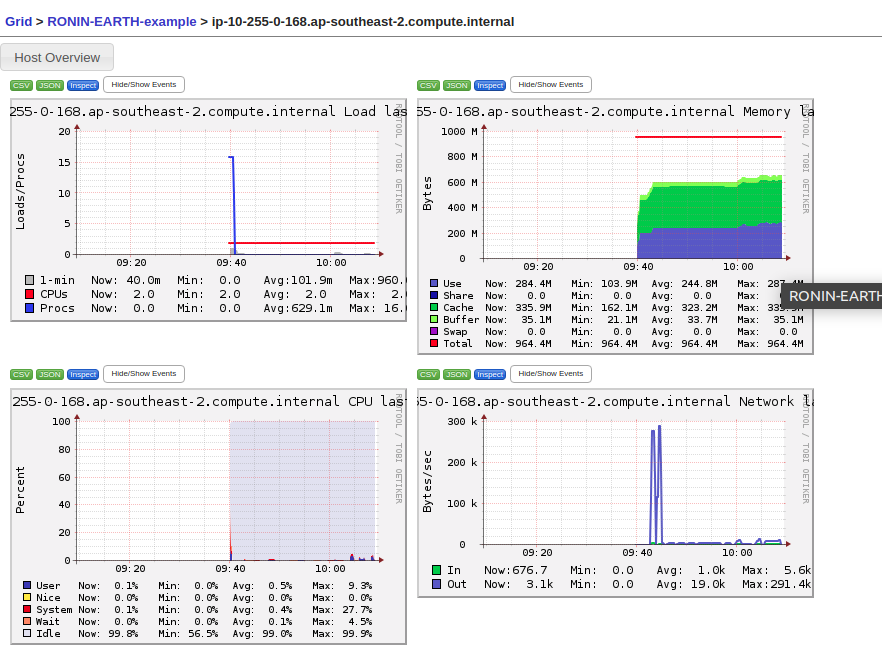
From here, you can also click the Node View button in the upper right to view contextual information about the node.
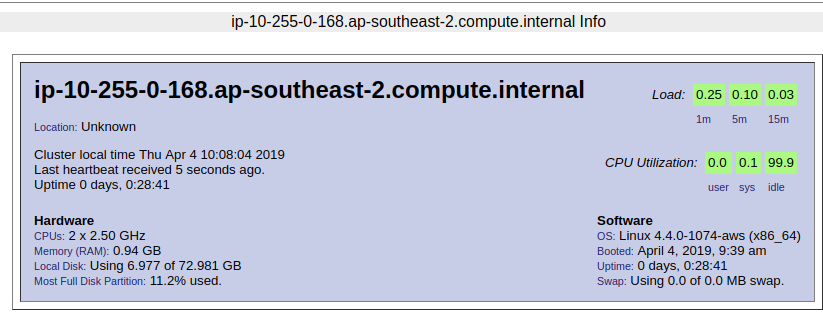
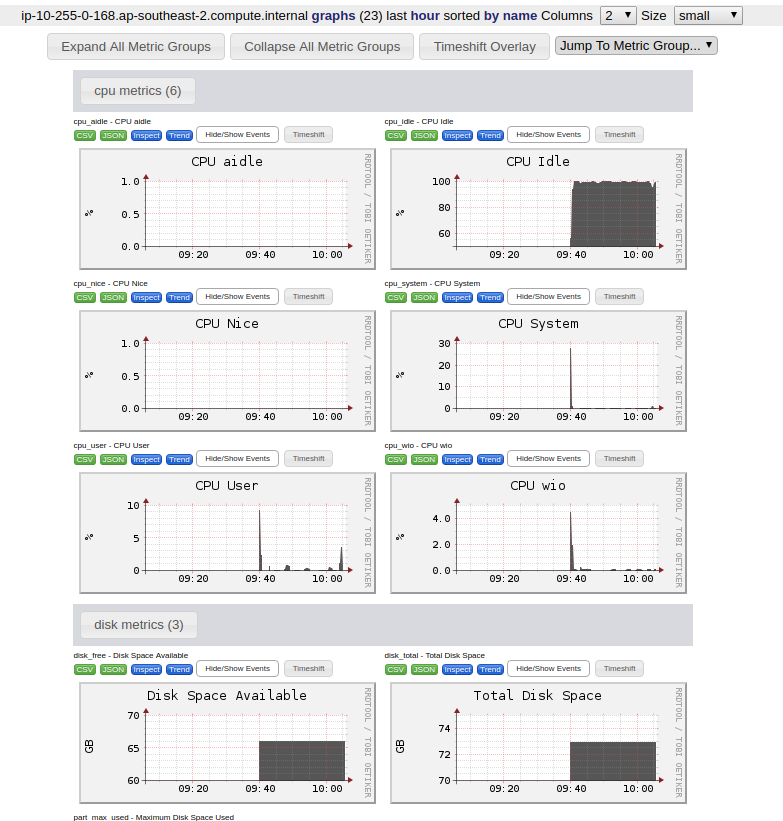
The rest of the main page displays a summary of the node. Click on any graph to view detailed information by various time increments, from one hour to one year, as well as to export graph data in CSV or JSON formats.
As your nodes grow and viewing them all on the main page becomes difficult, you can use the search tab to find particular hosts or metrics, using regular expressions. You can also compare hosts, create custom aggregate graphs, and more.
Does anyone else have some cool tips on how they use Ganglia? Hit us up in the comments.
Otherwise, get excited!